Summary Background
APPENDIX E
Location Quotient Analyses
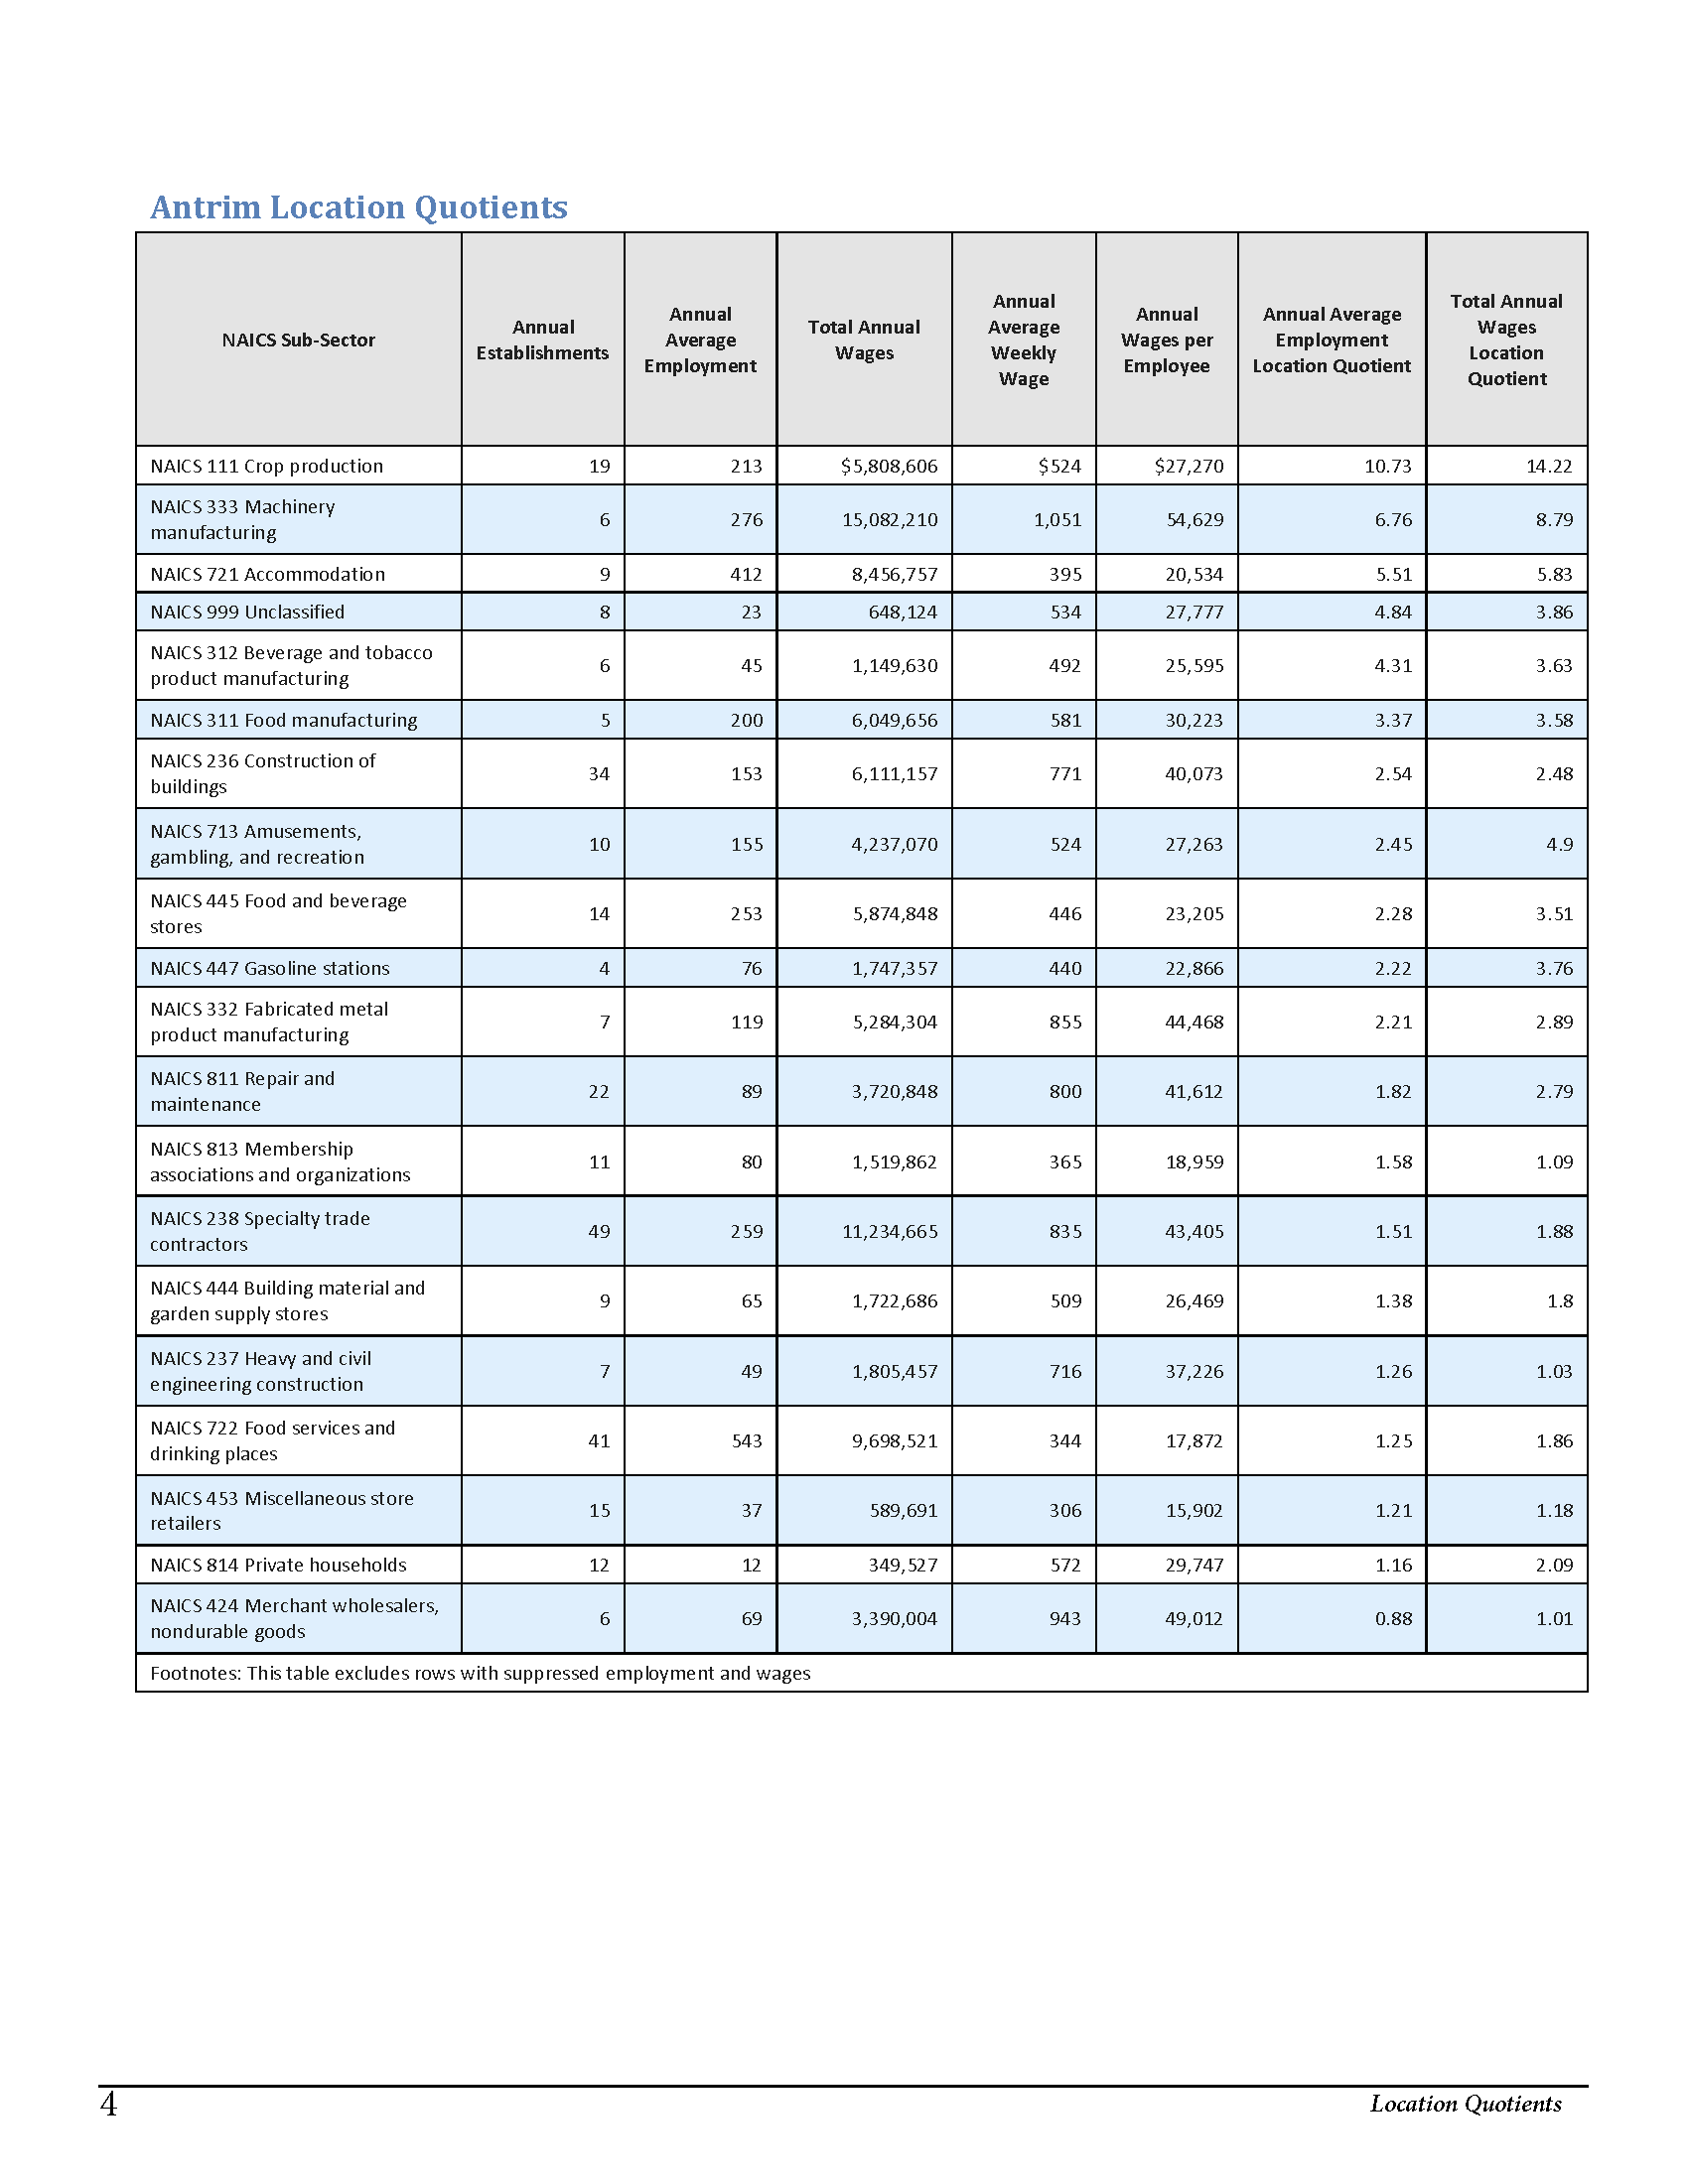
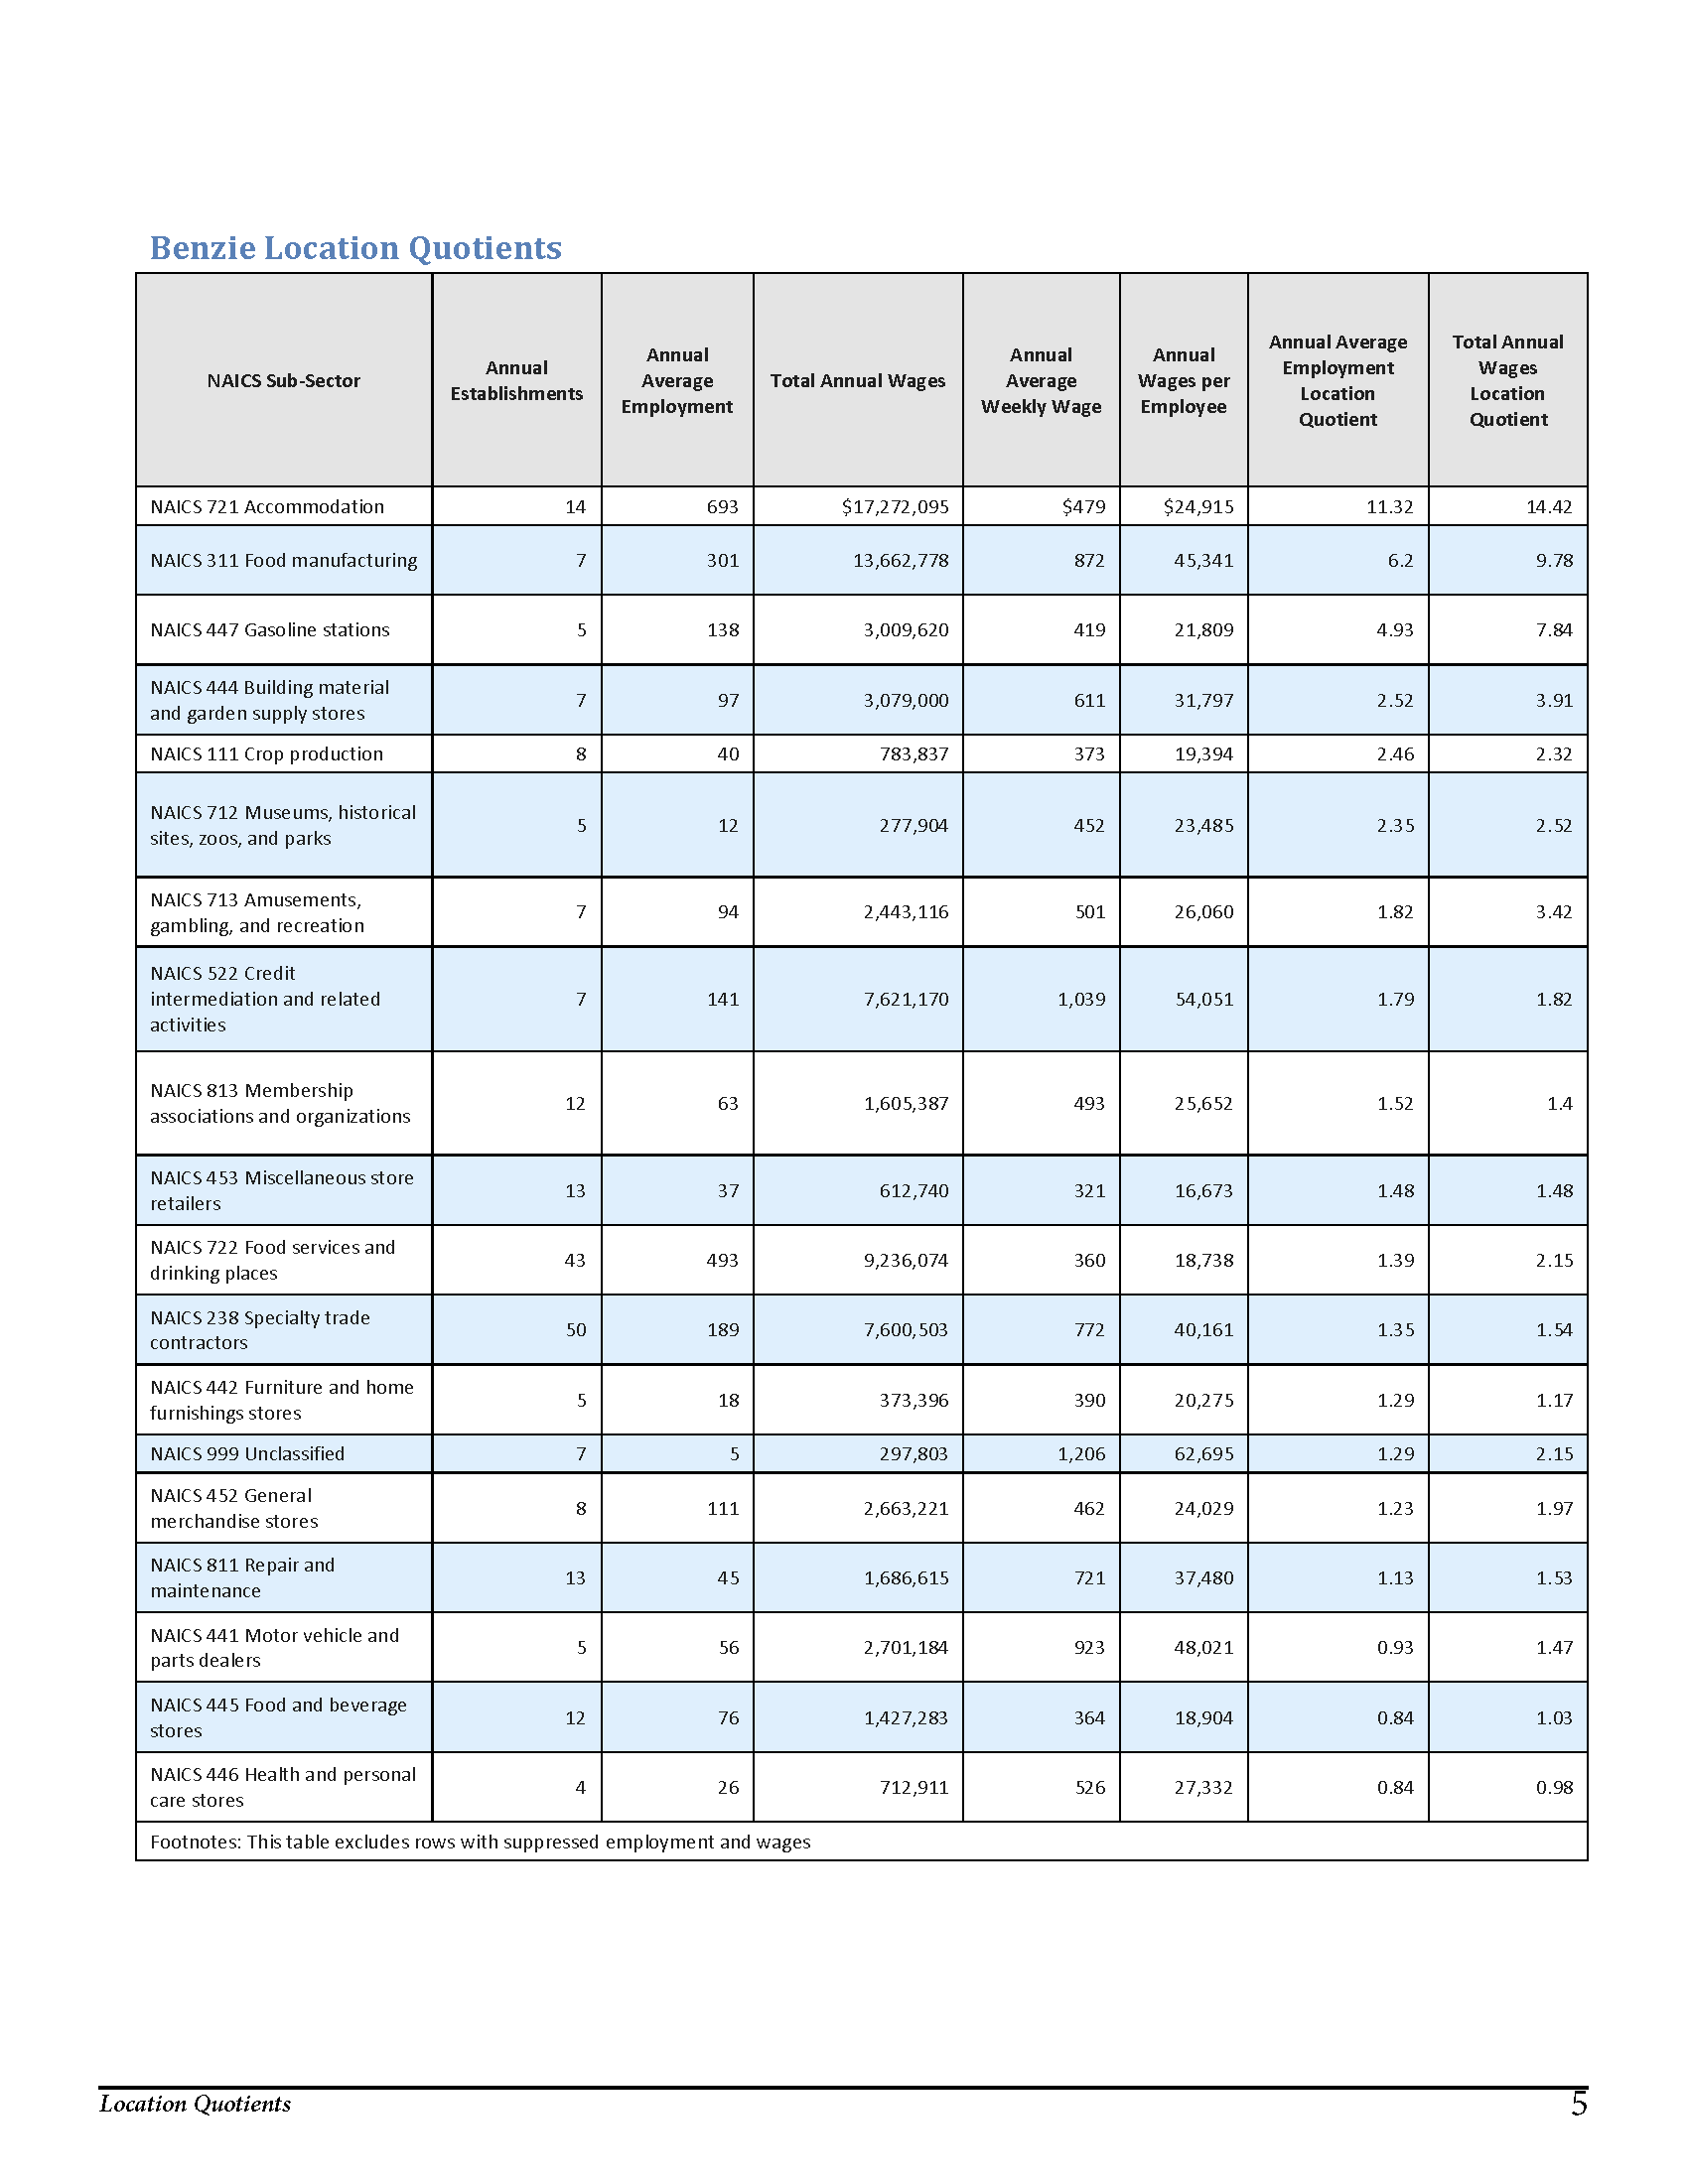
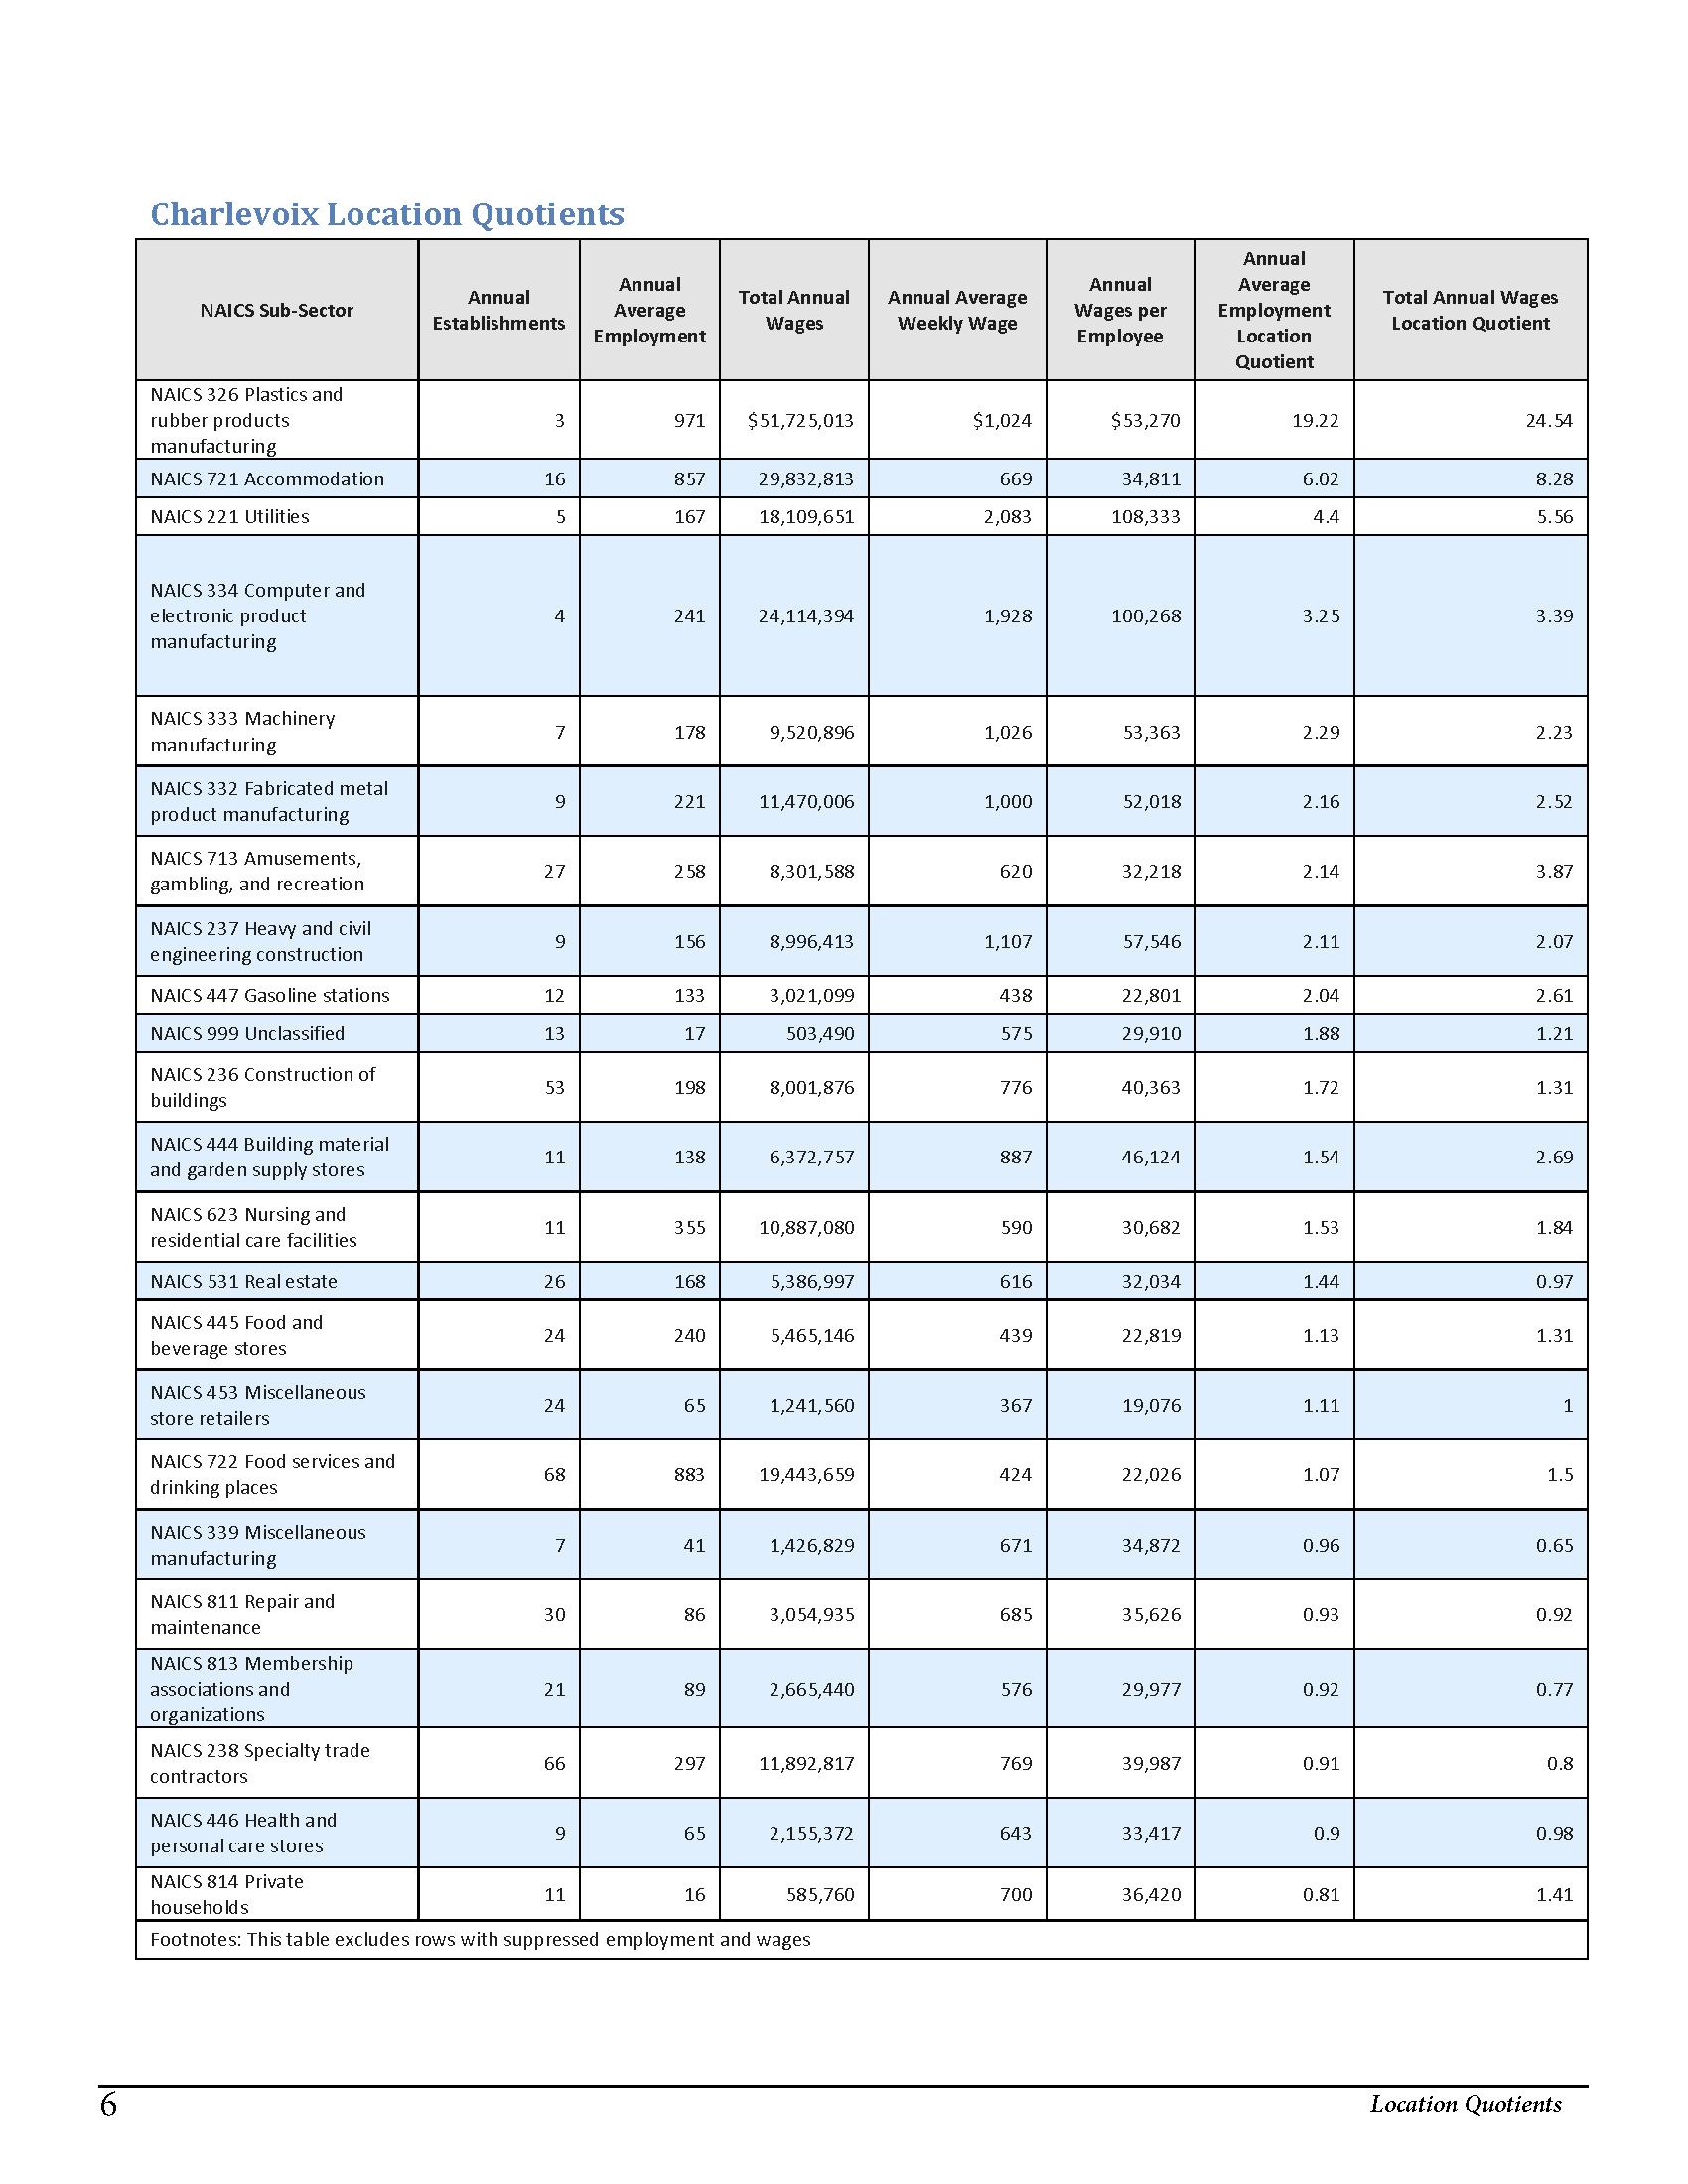
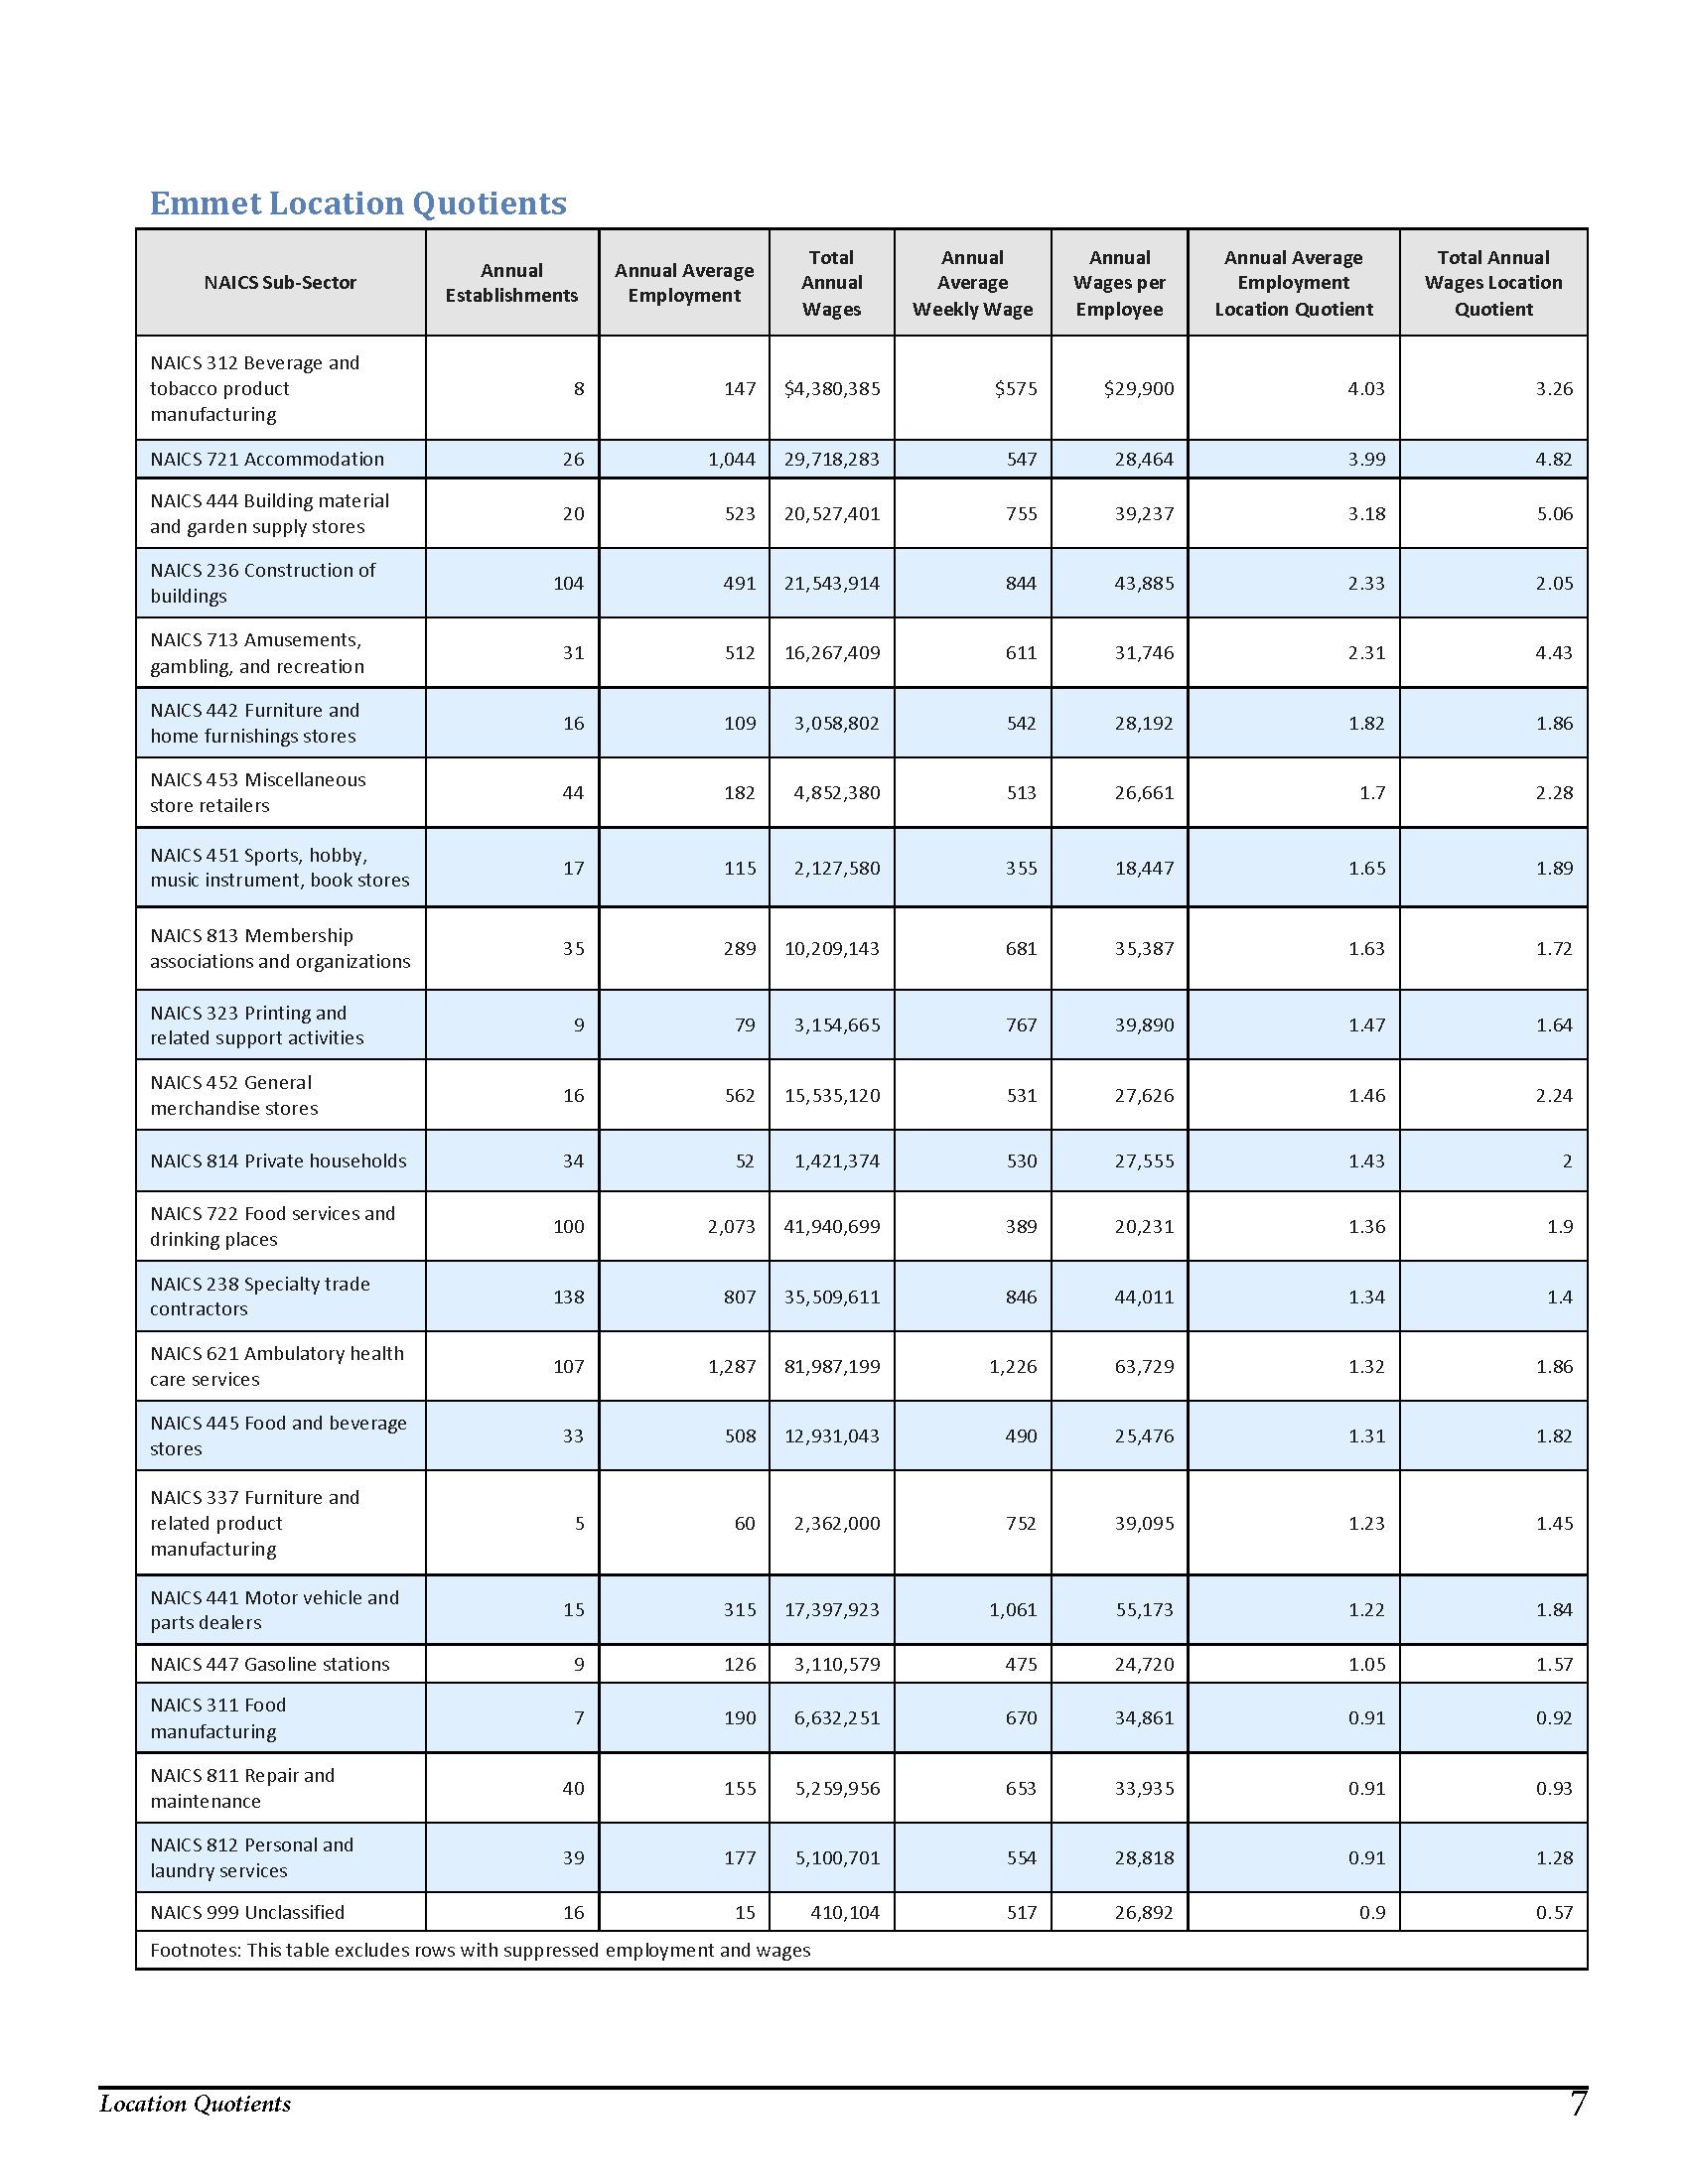
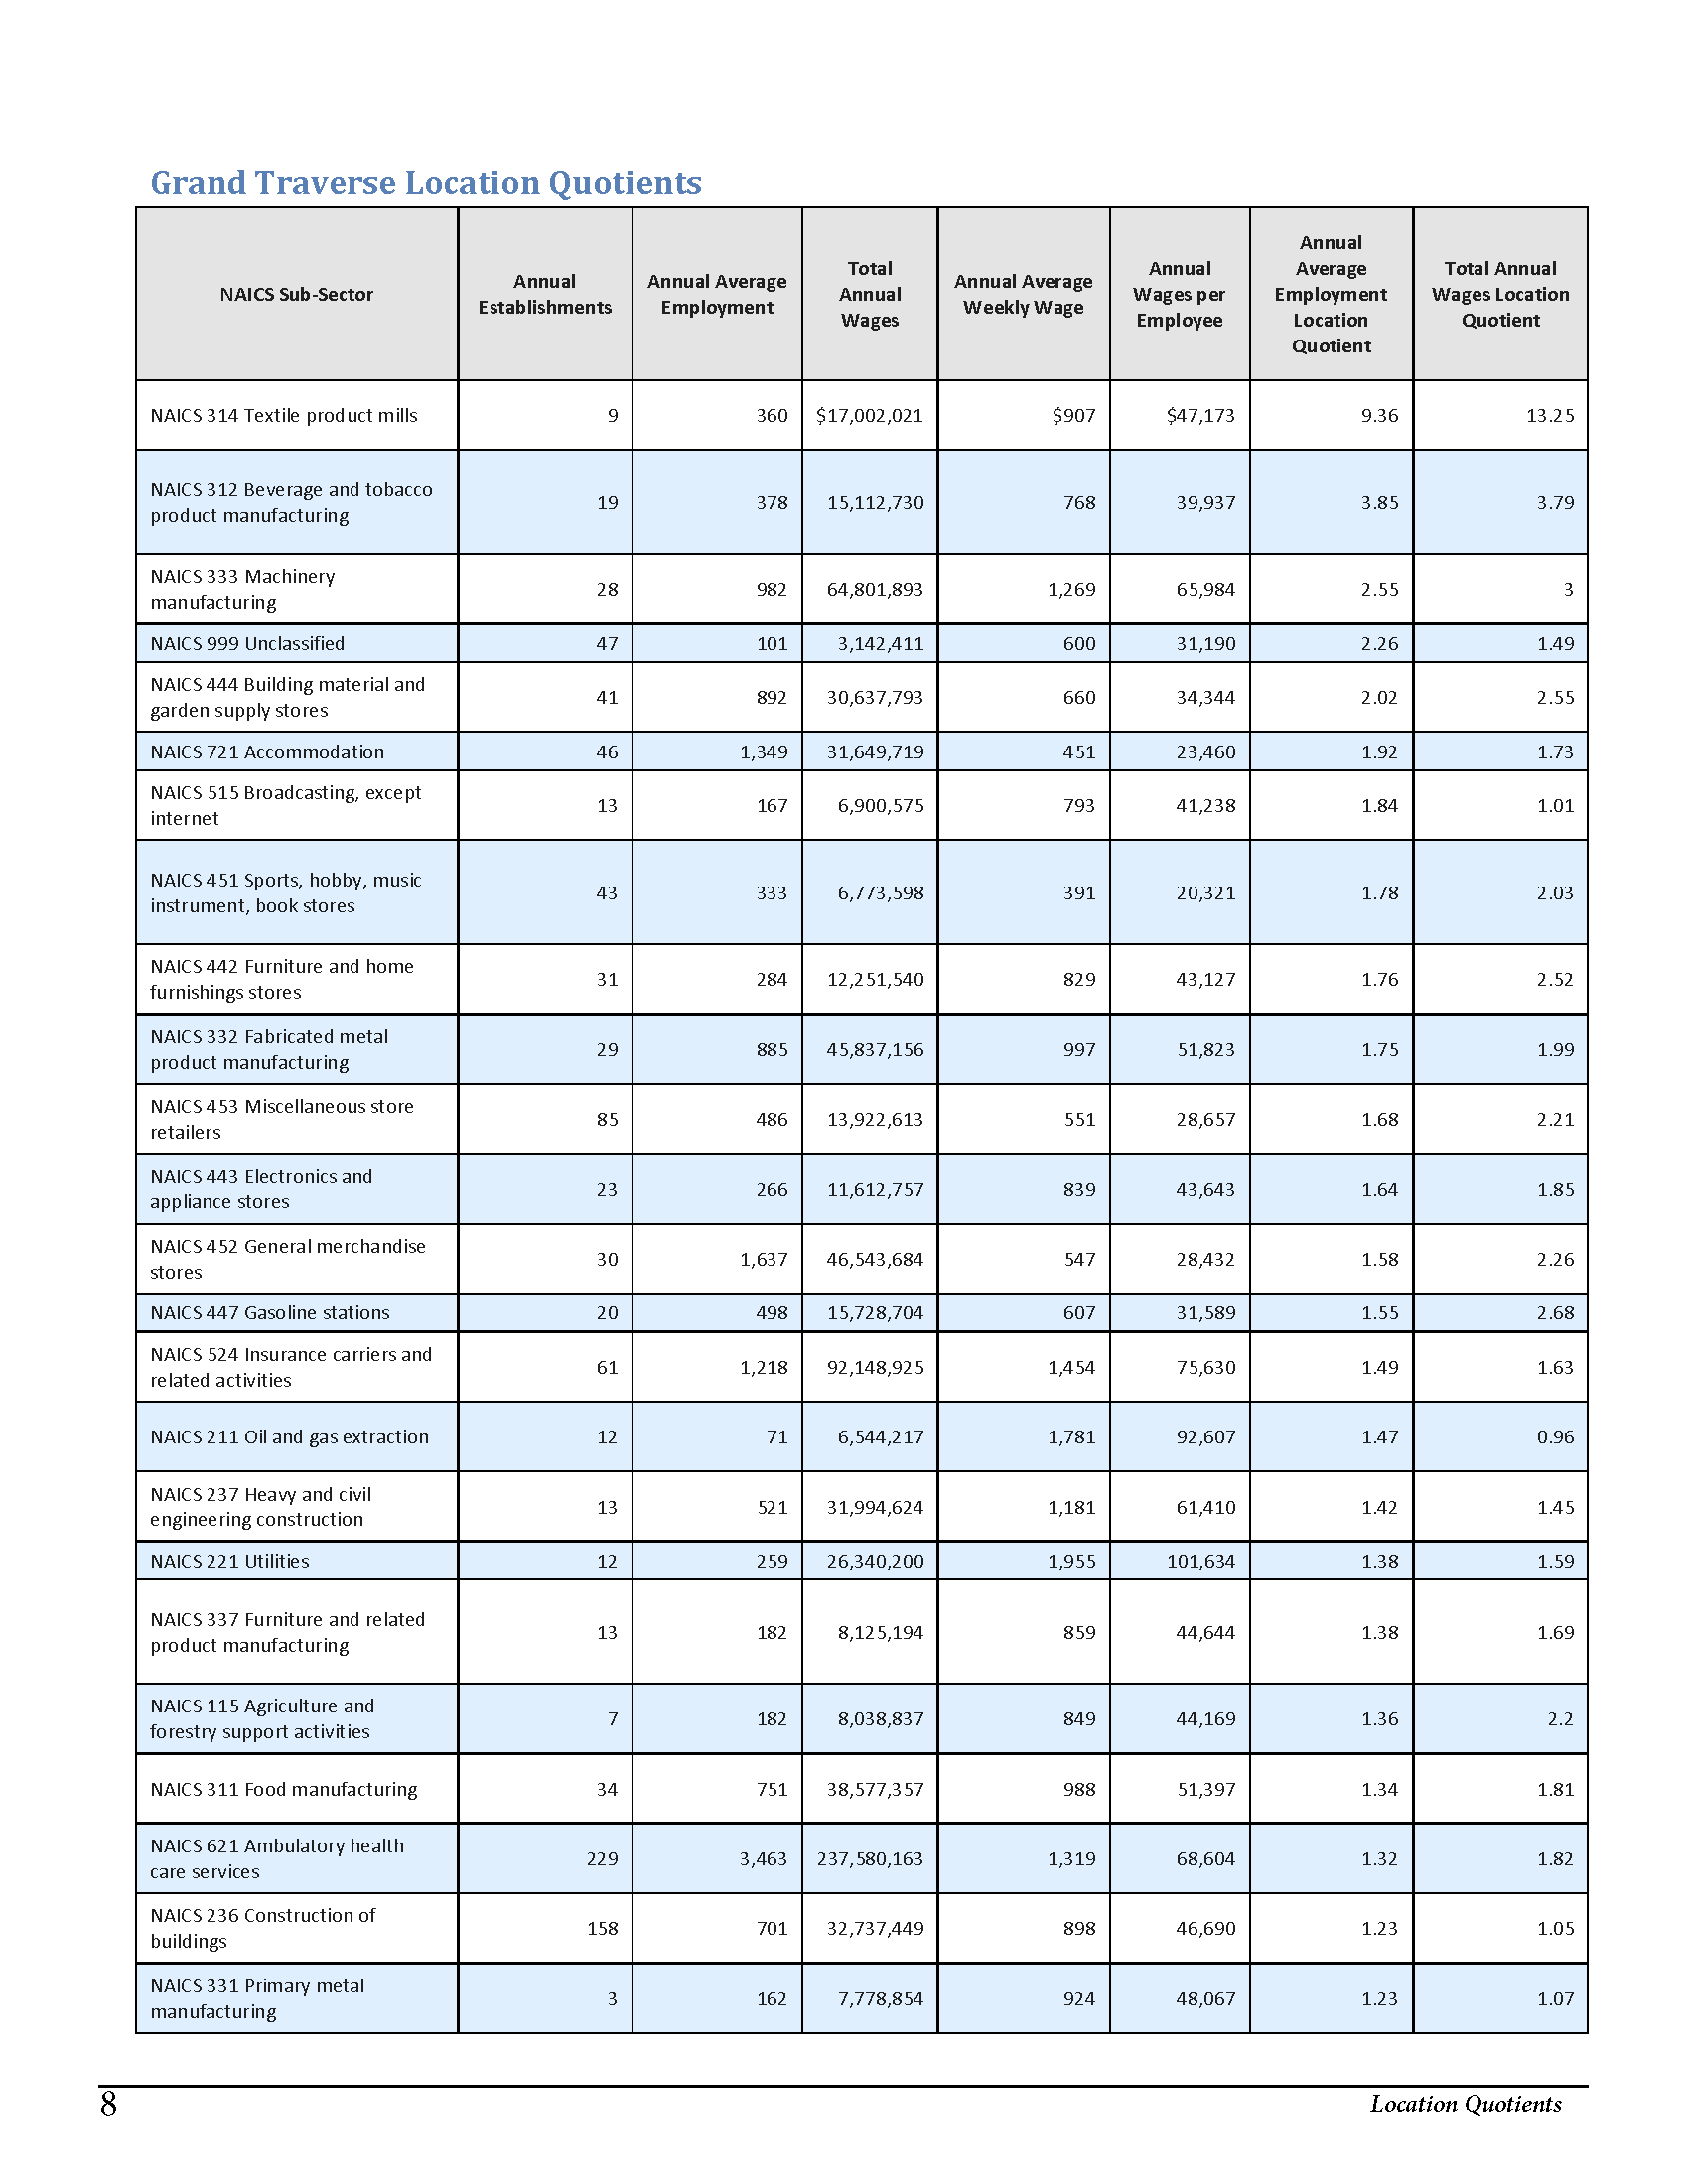
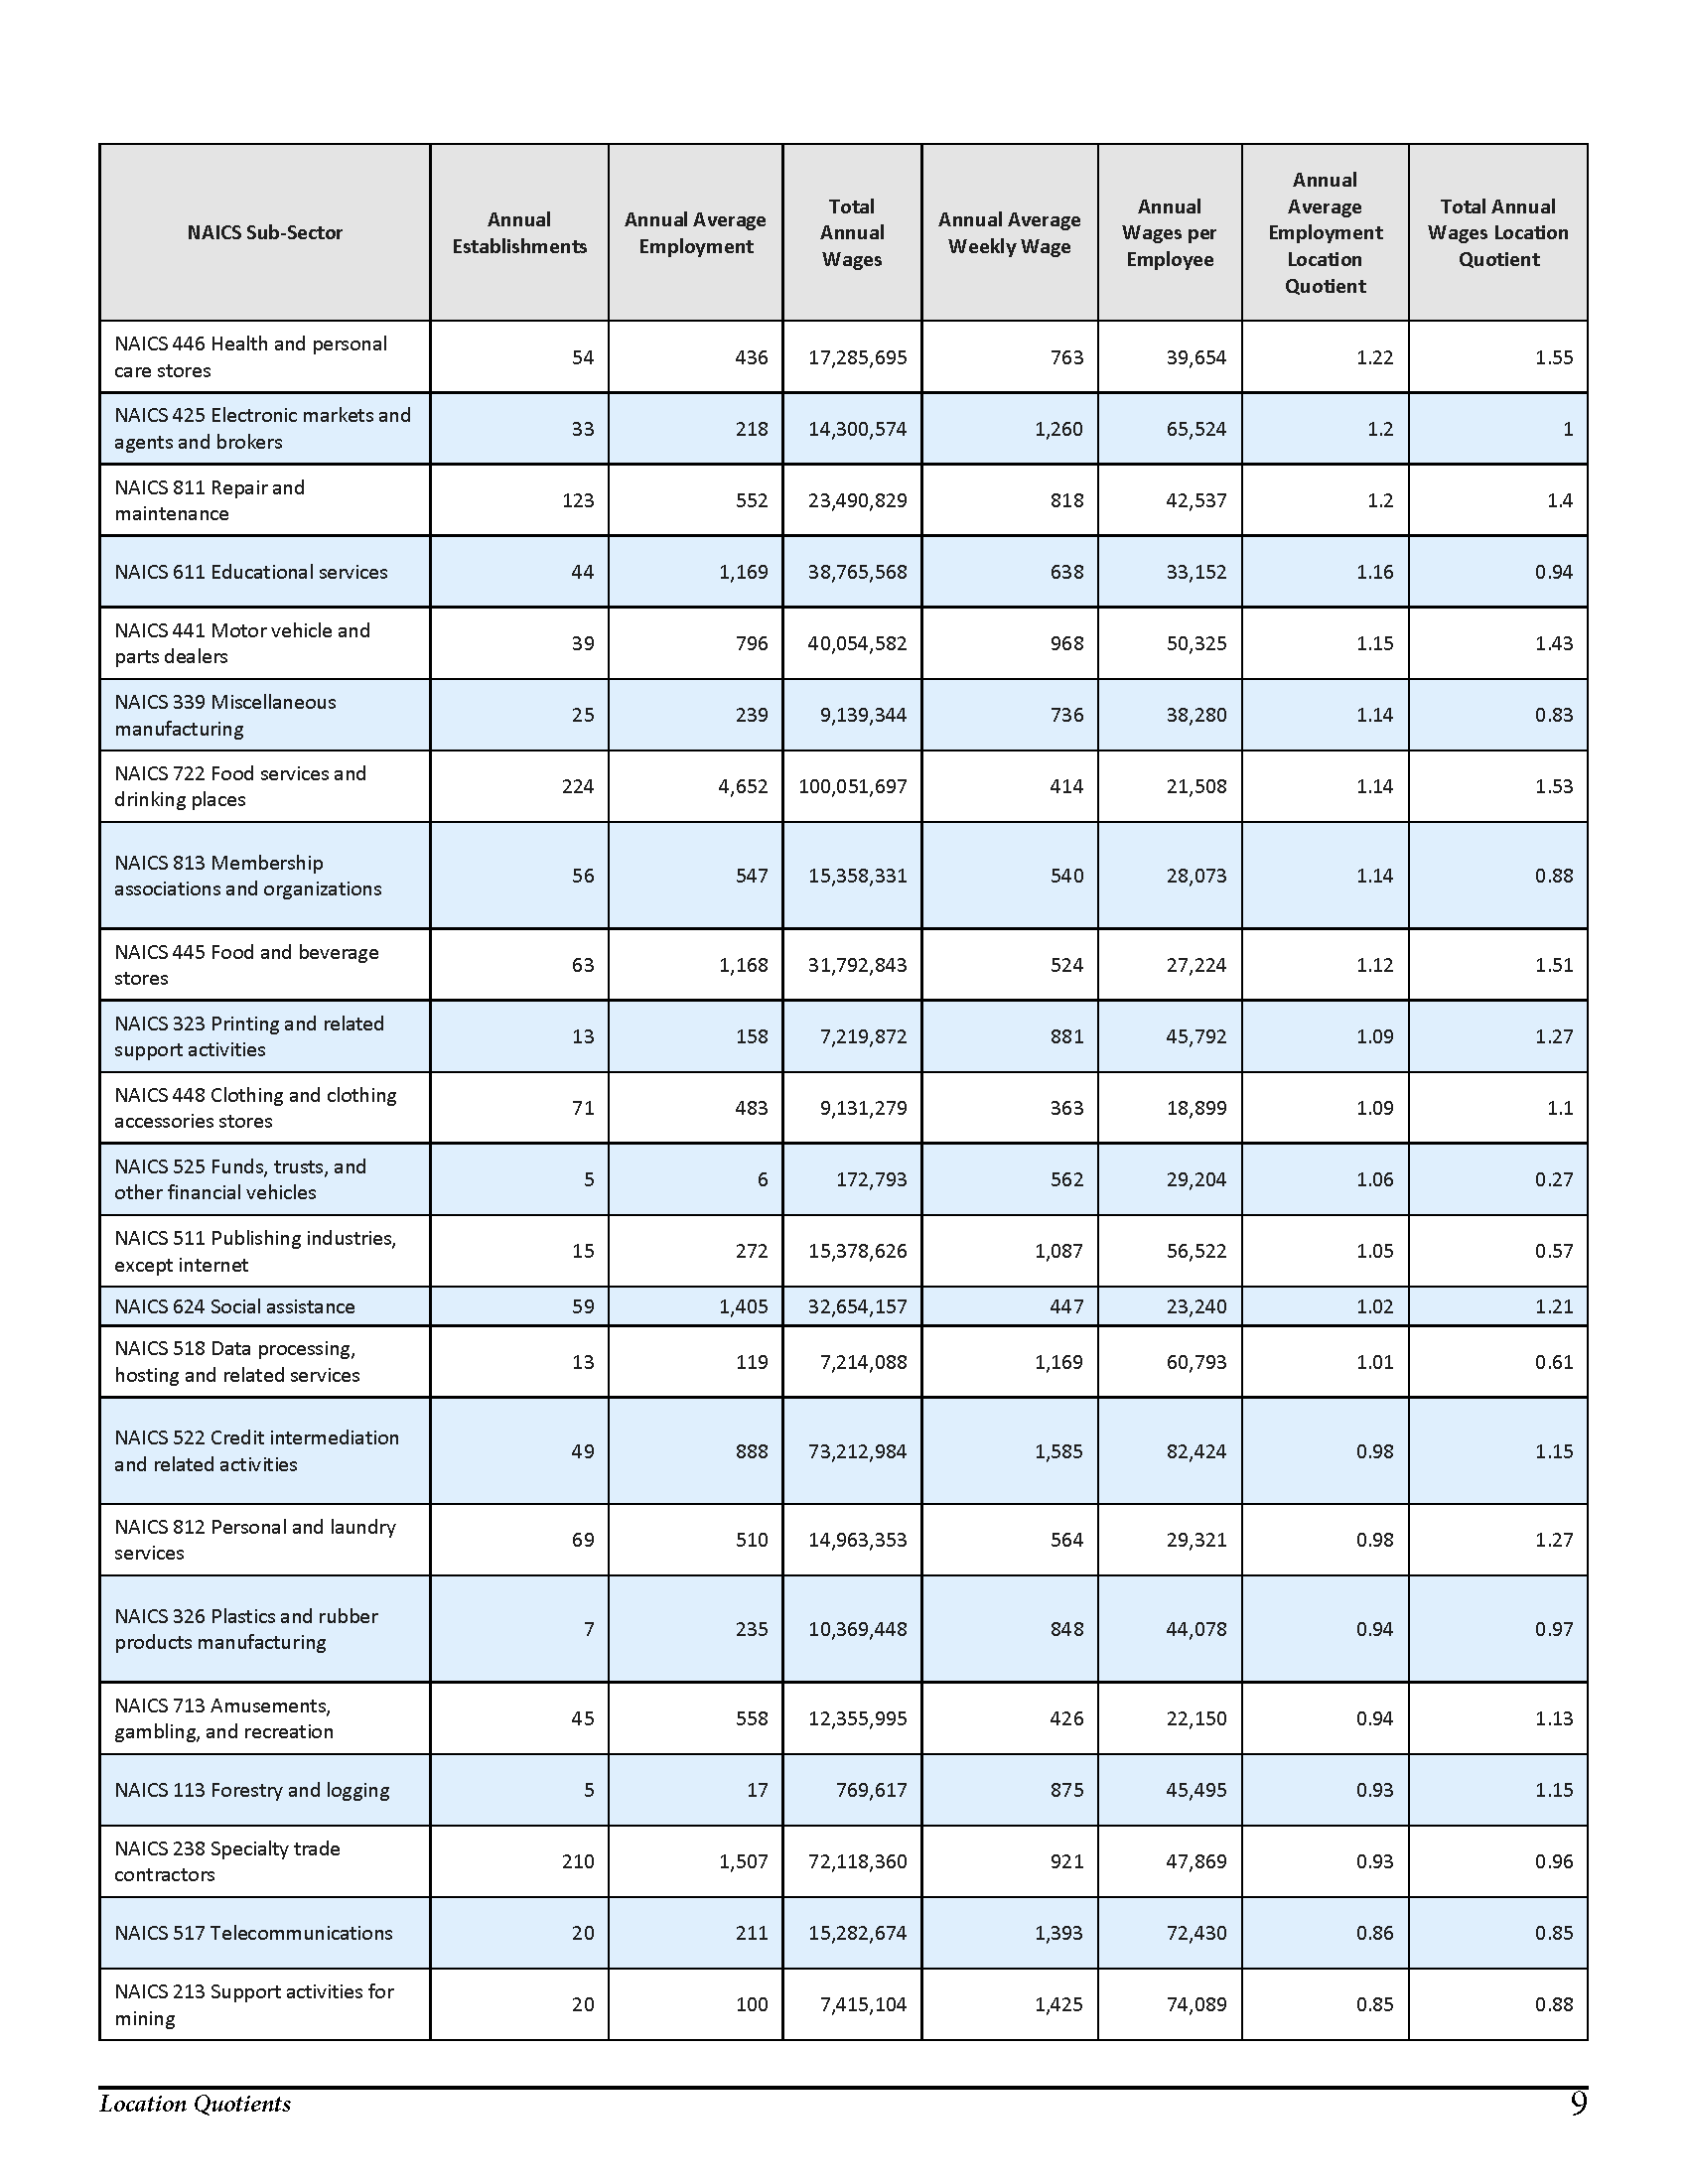
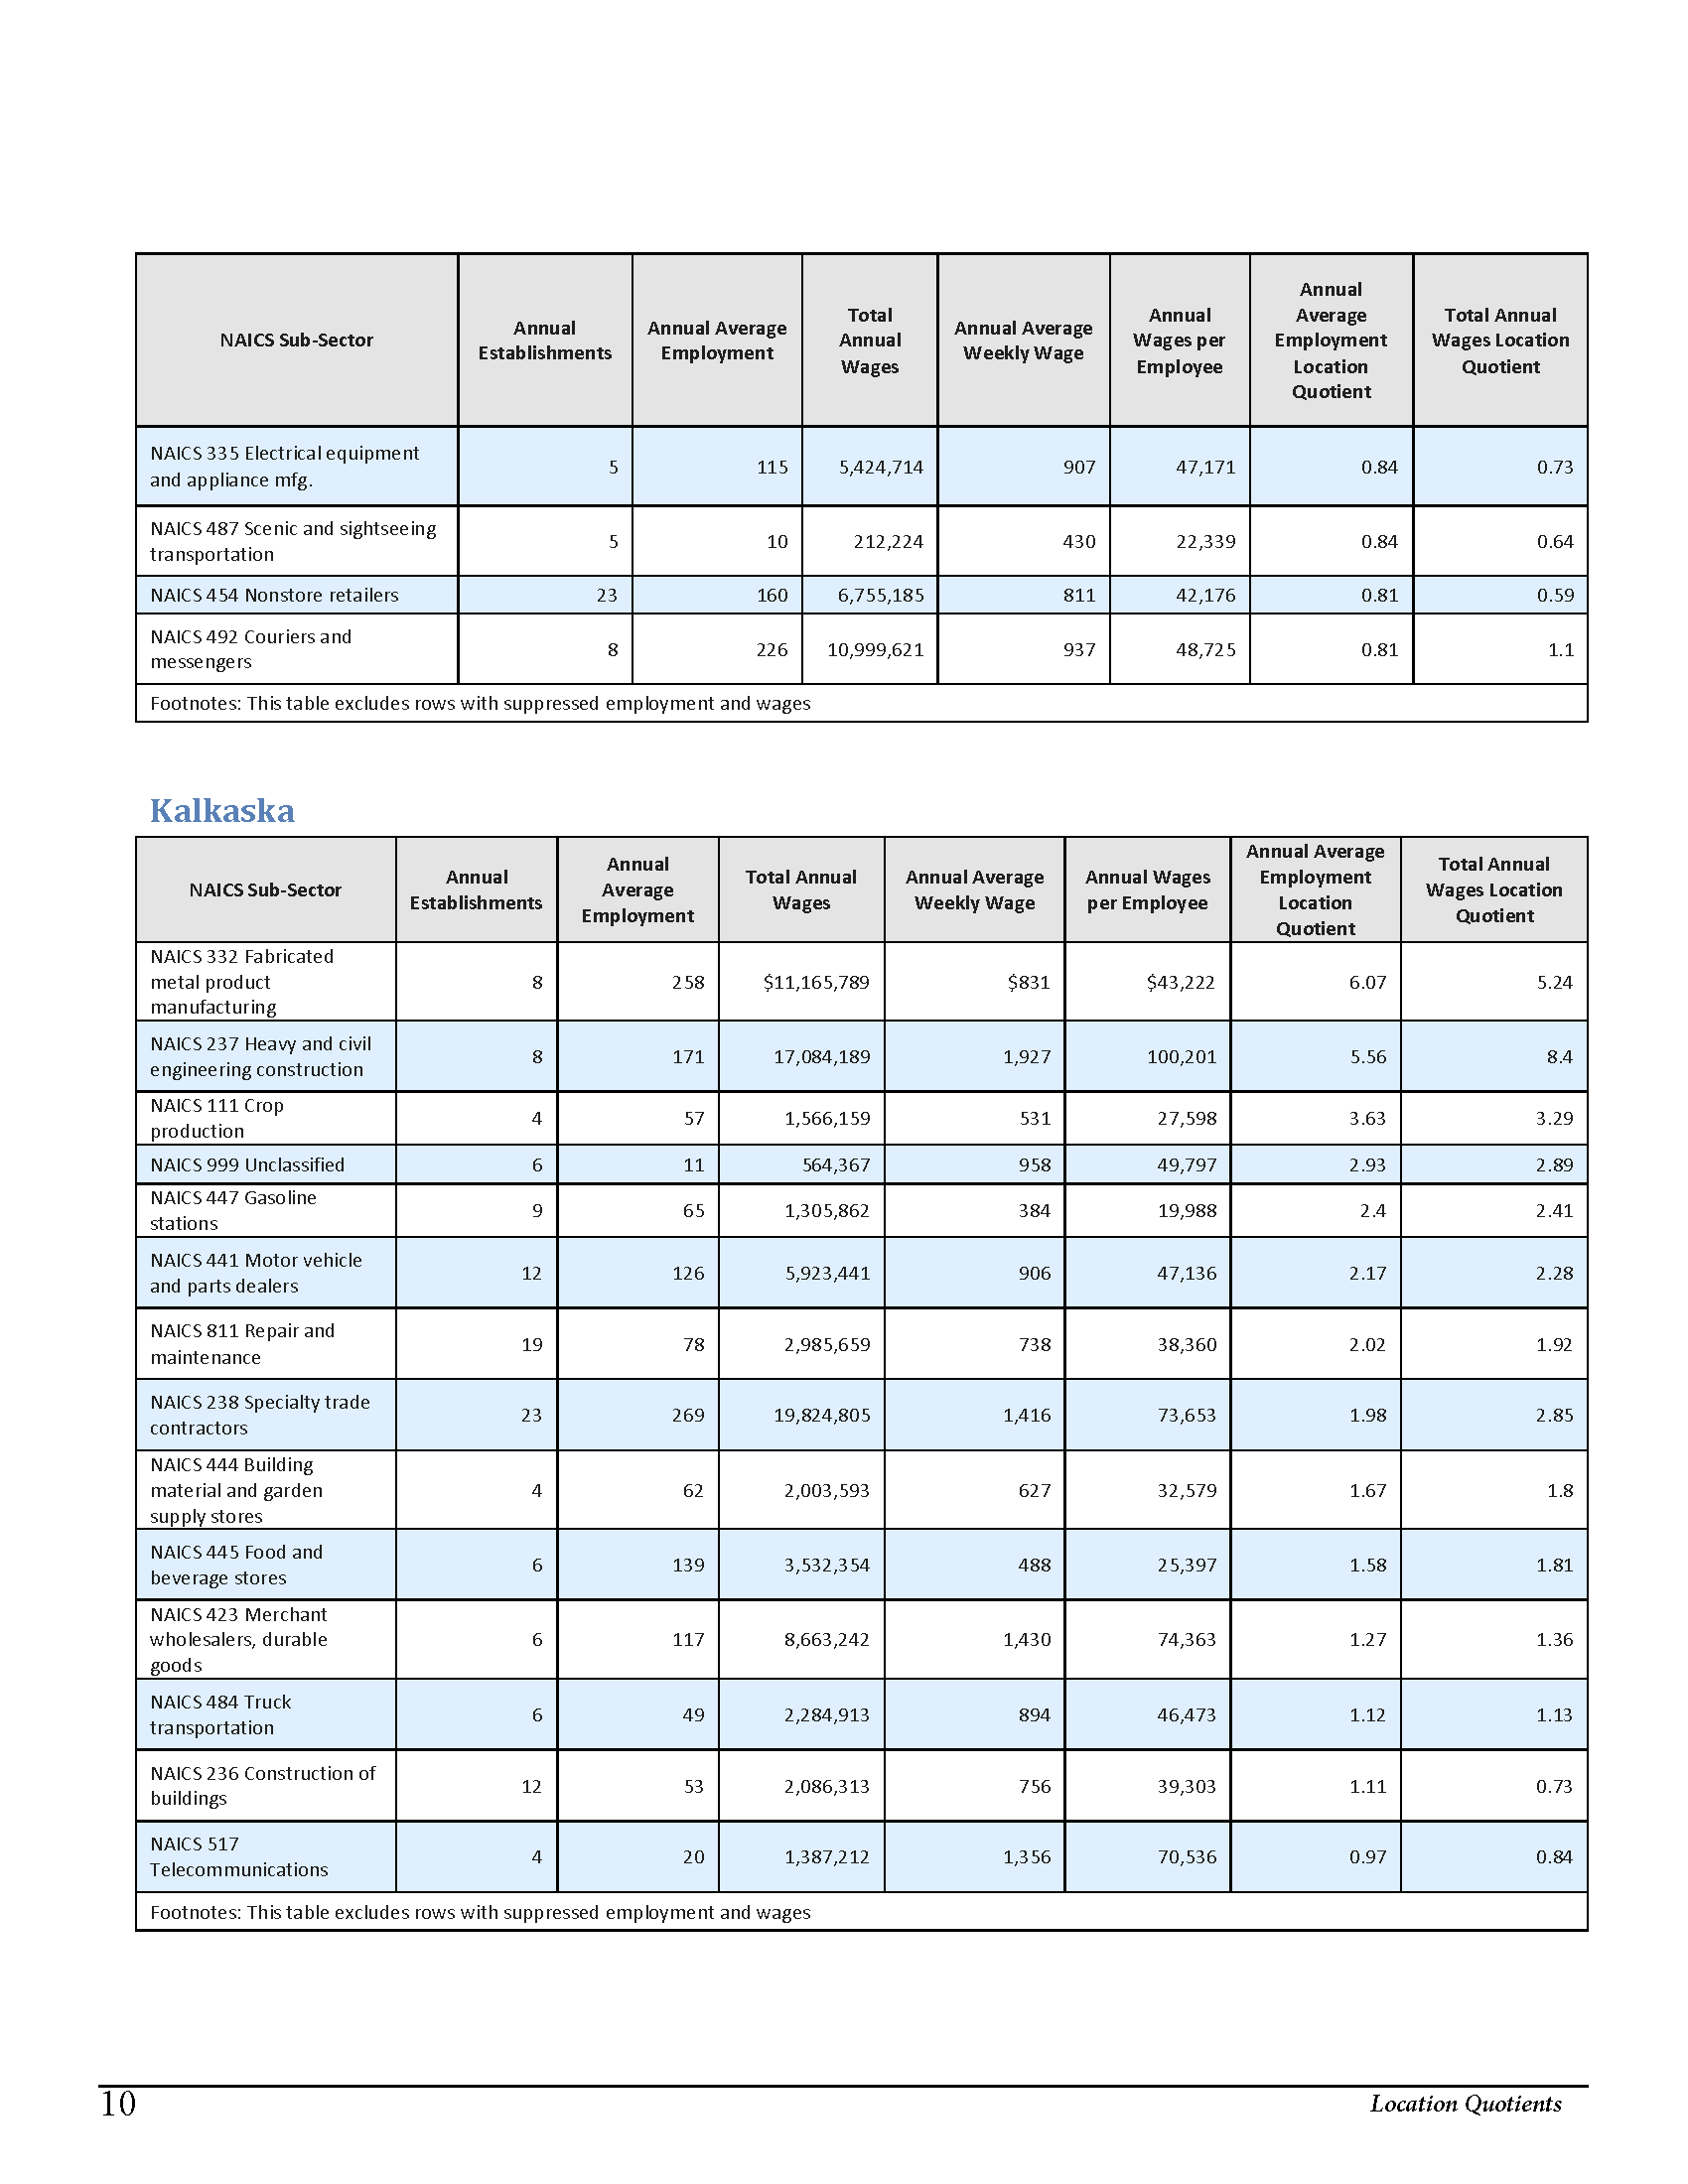
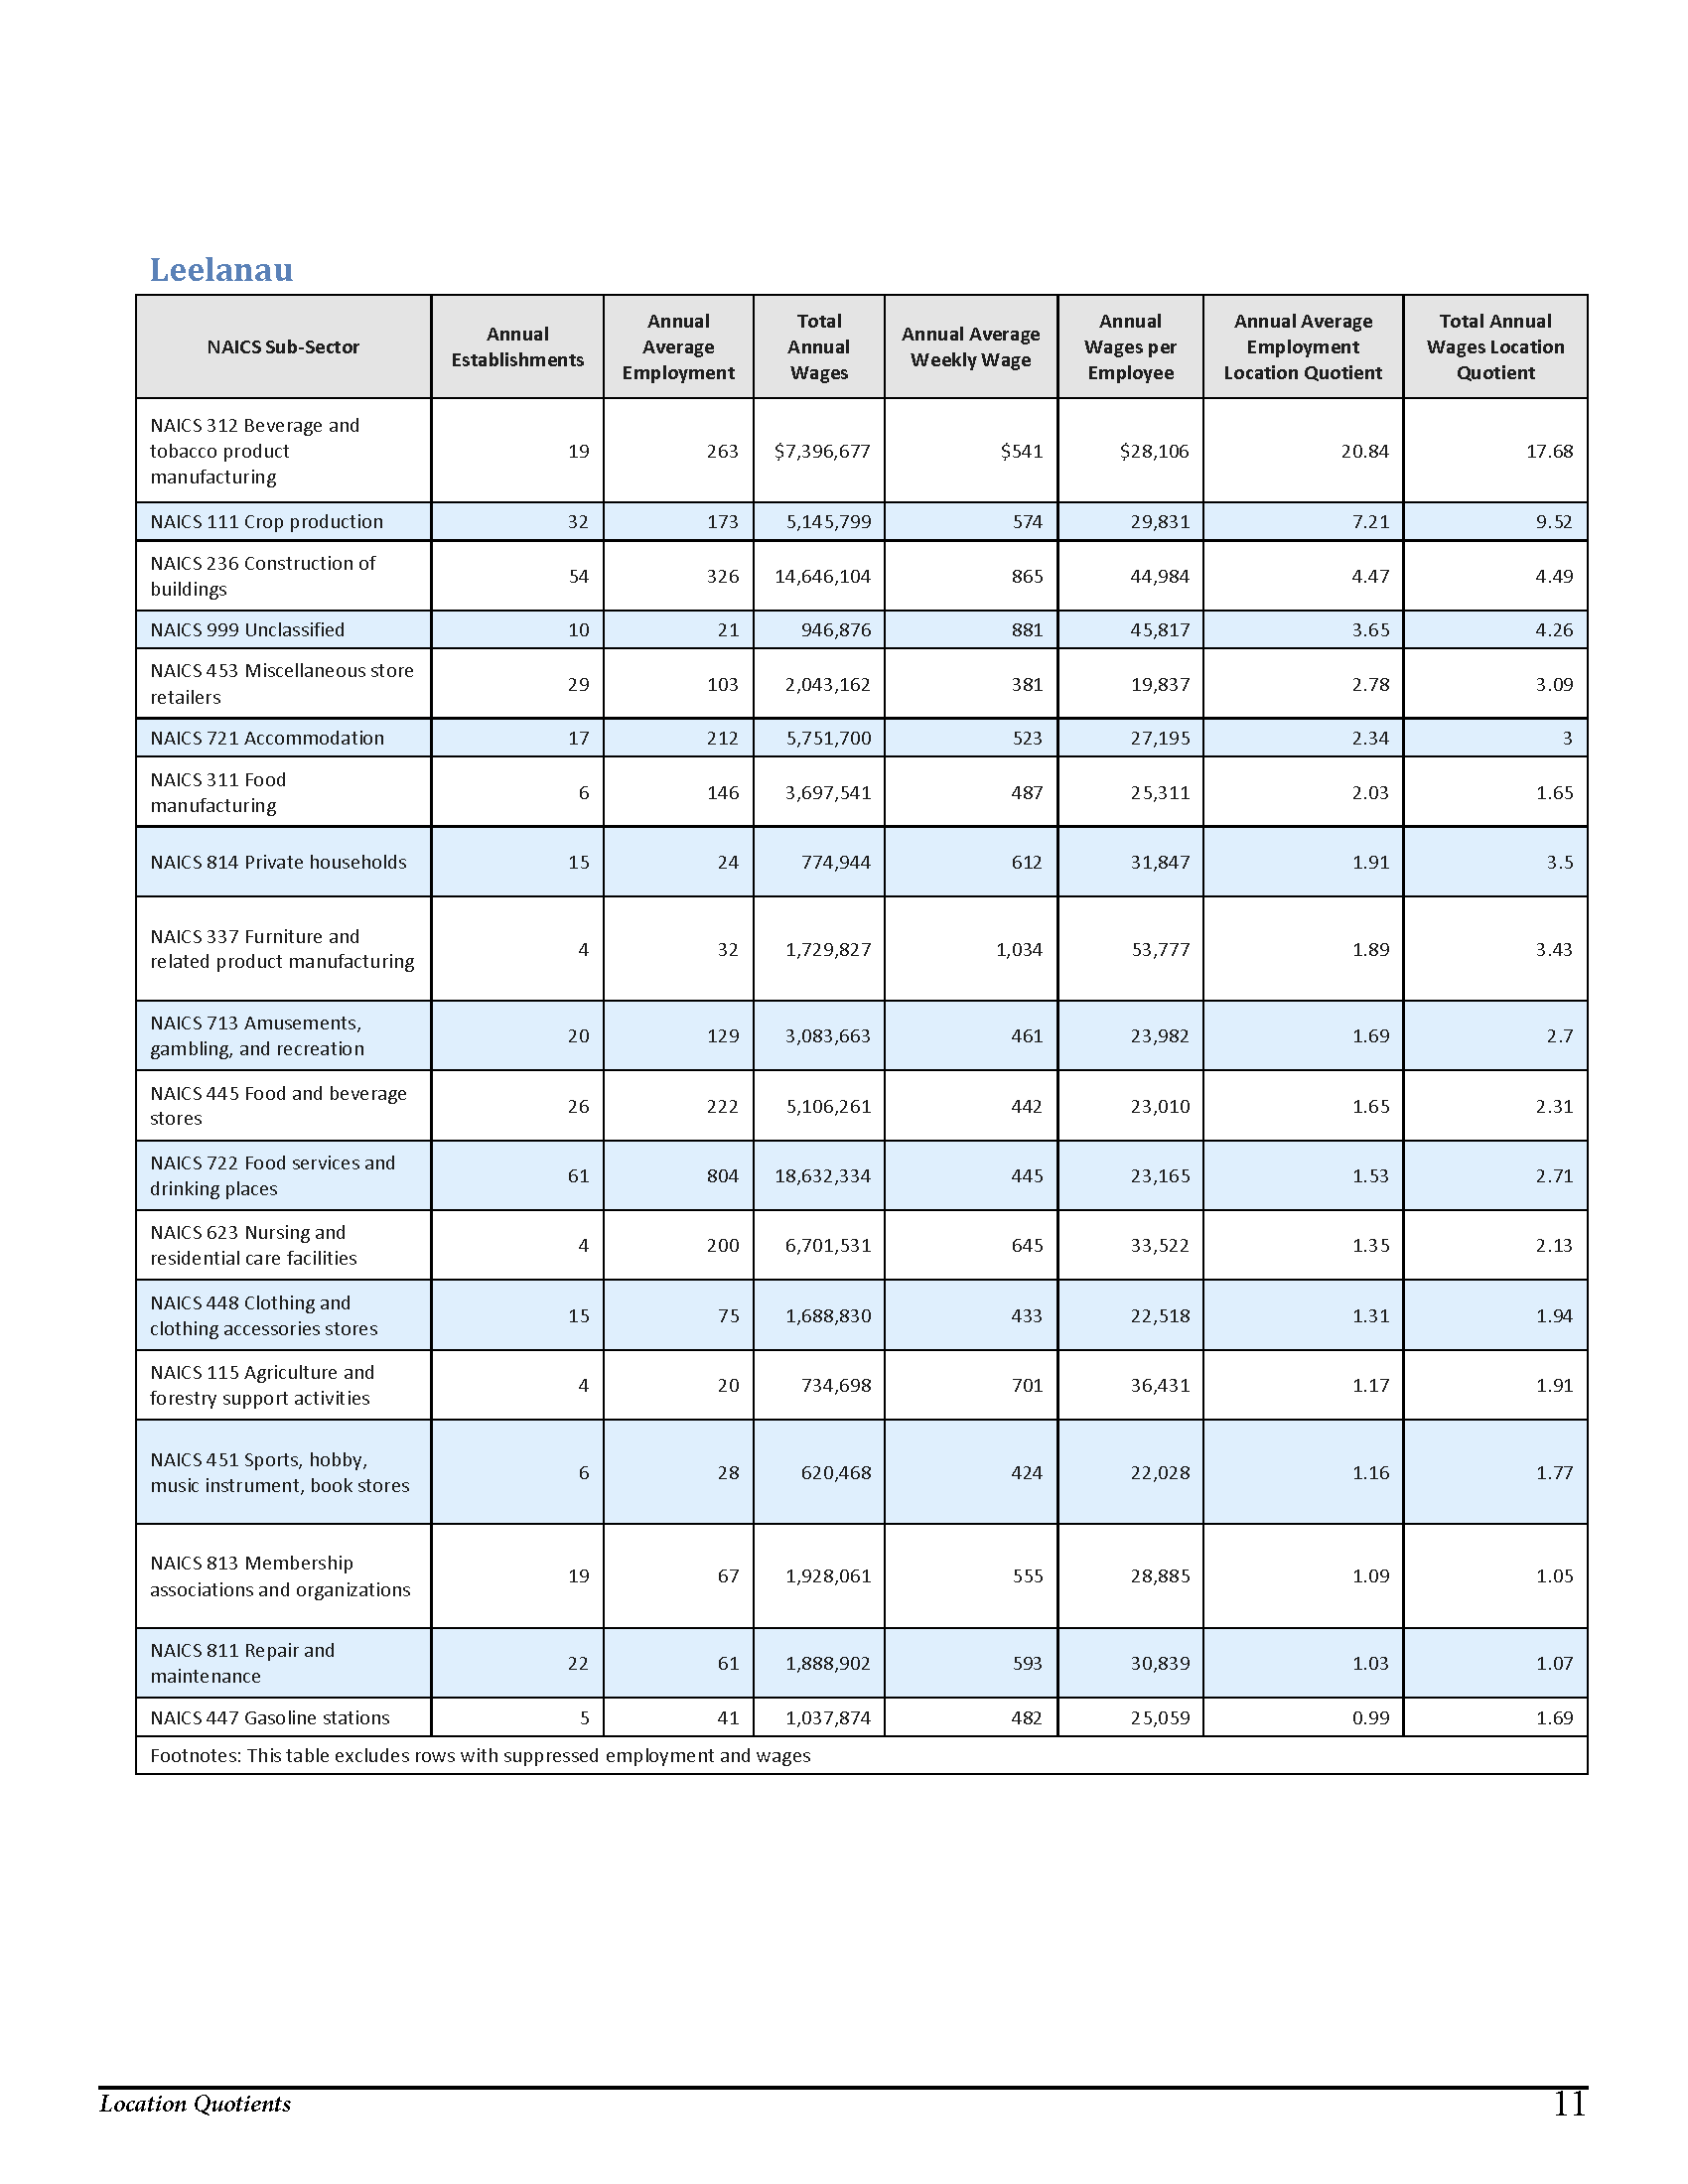
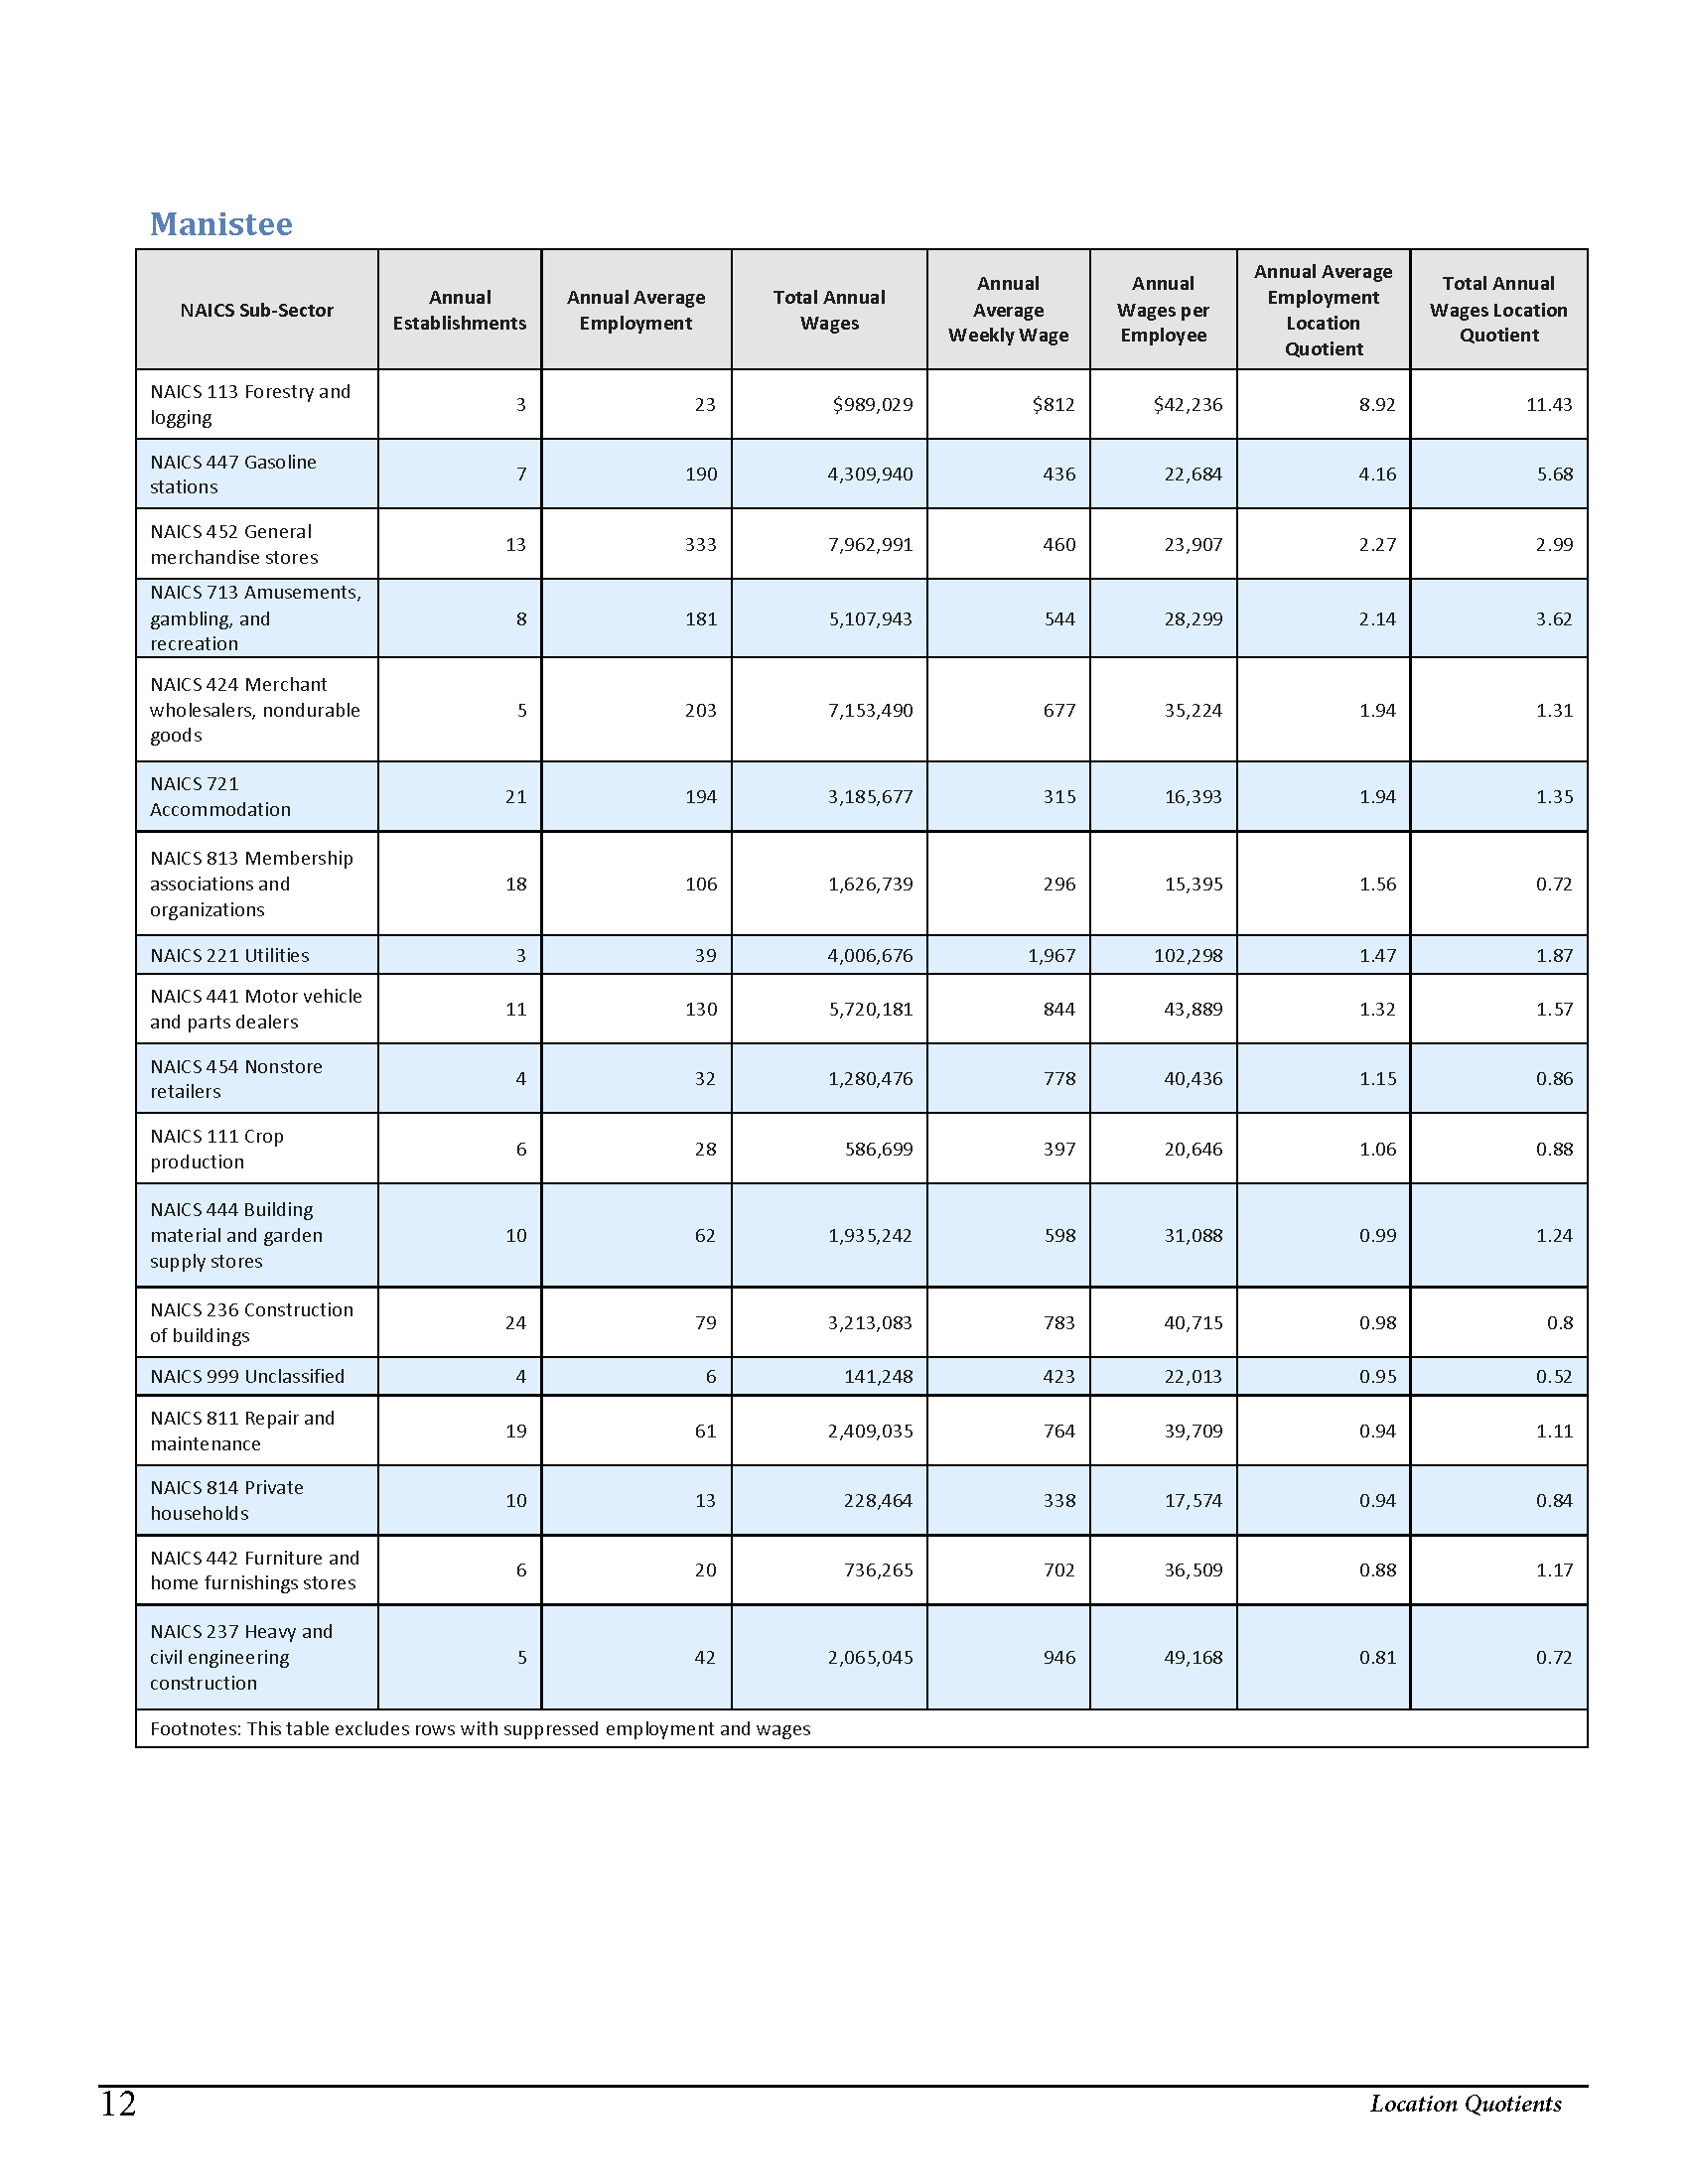
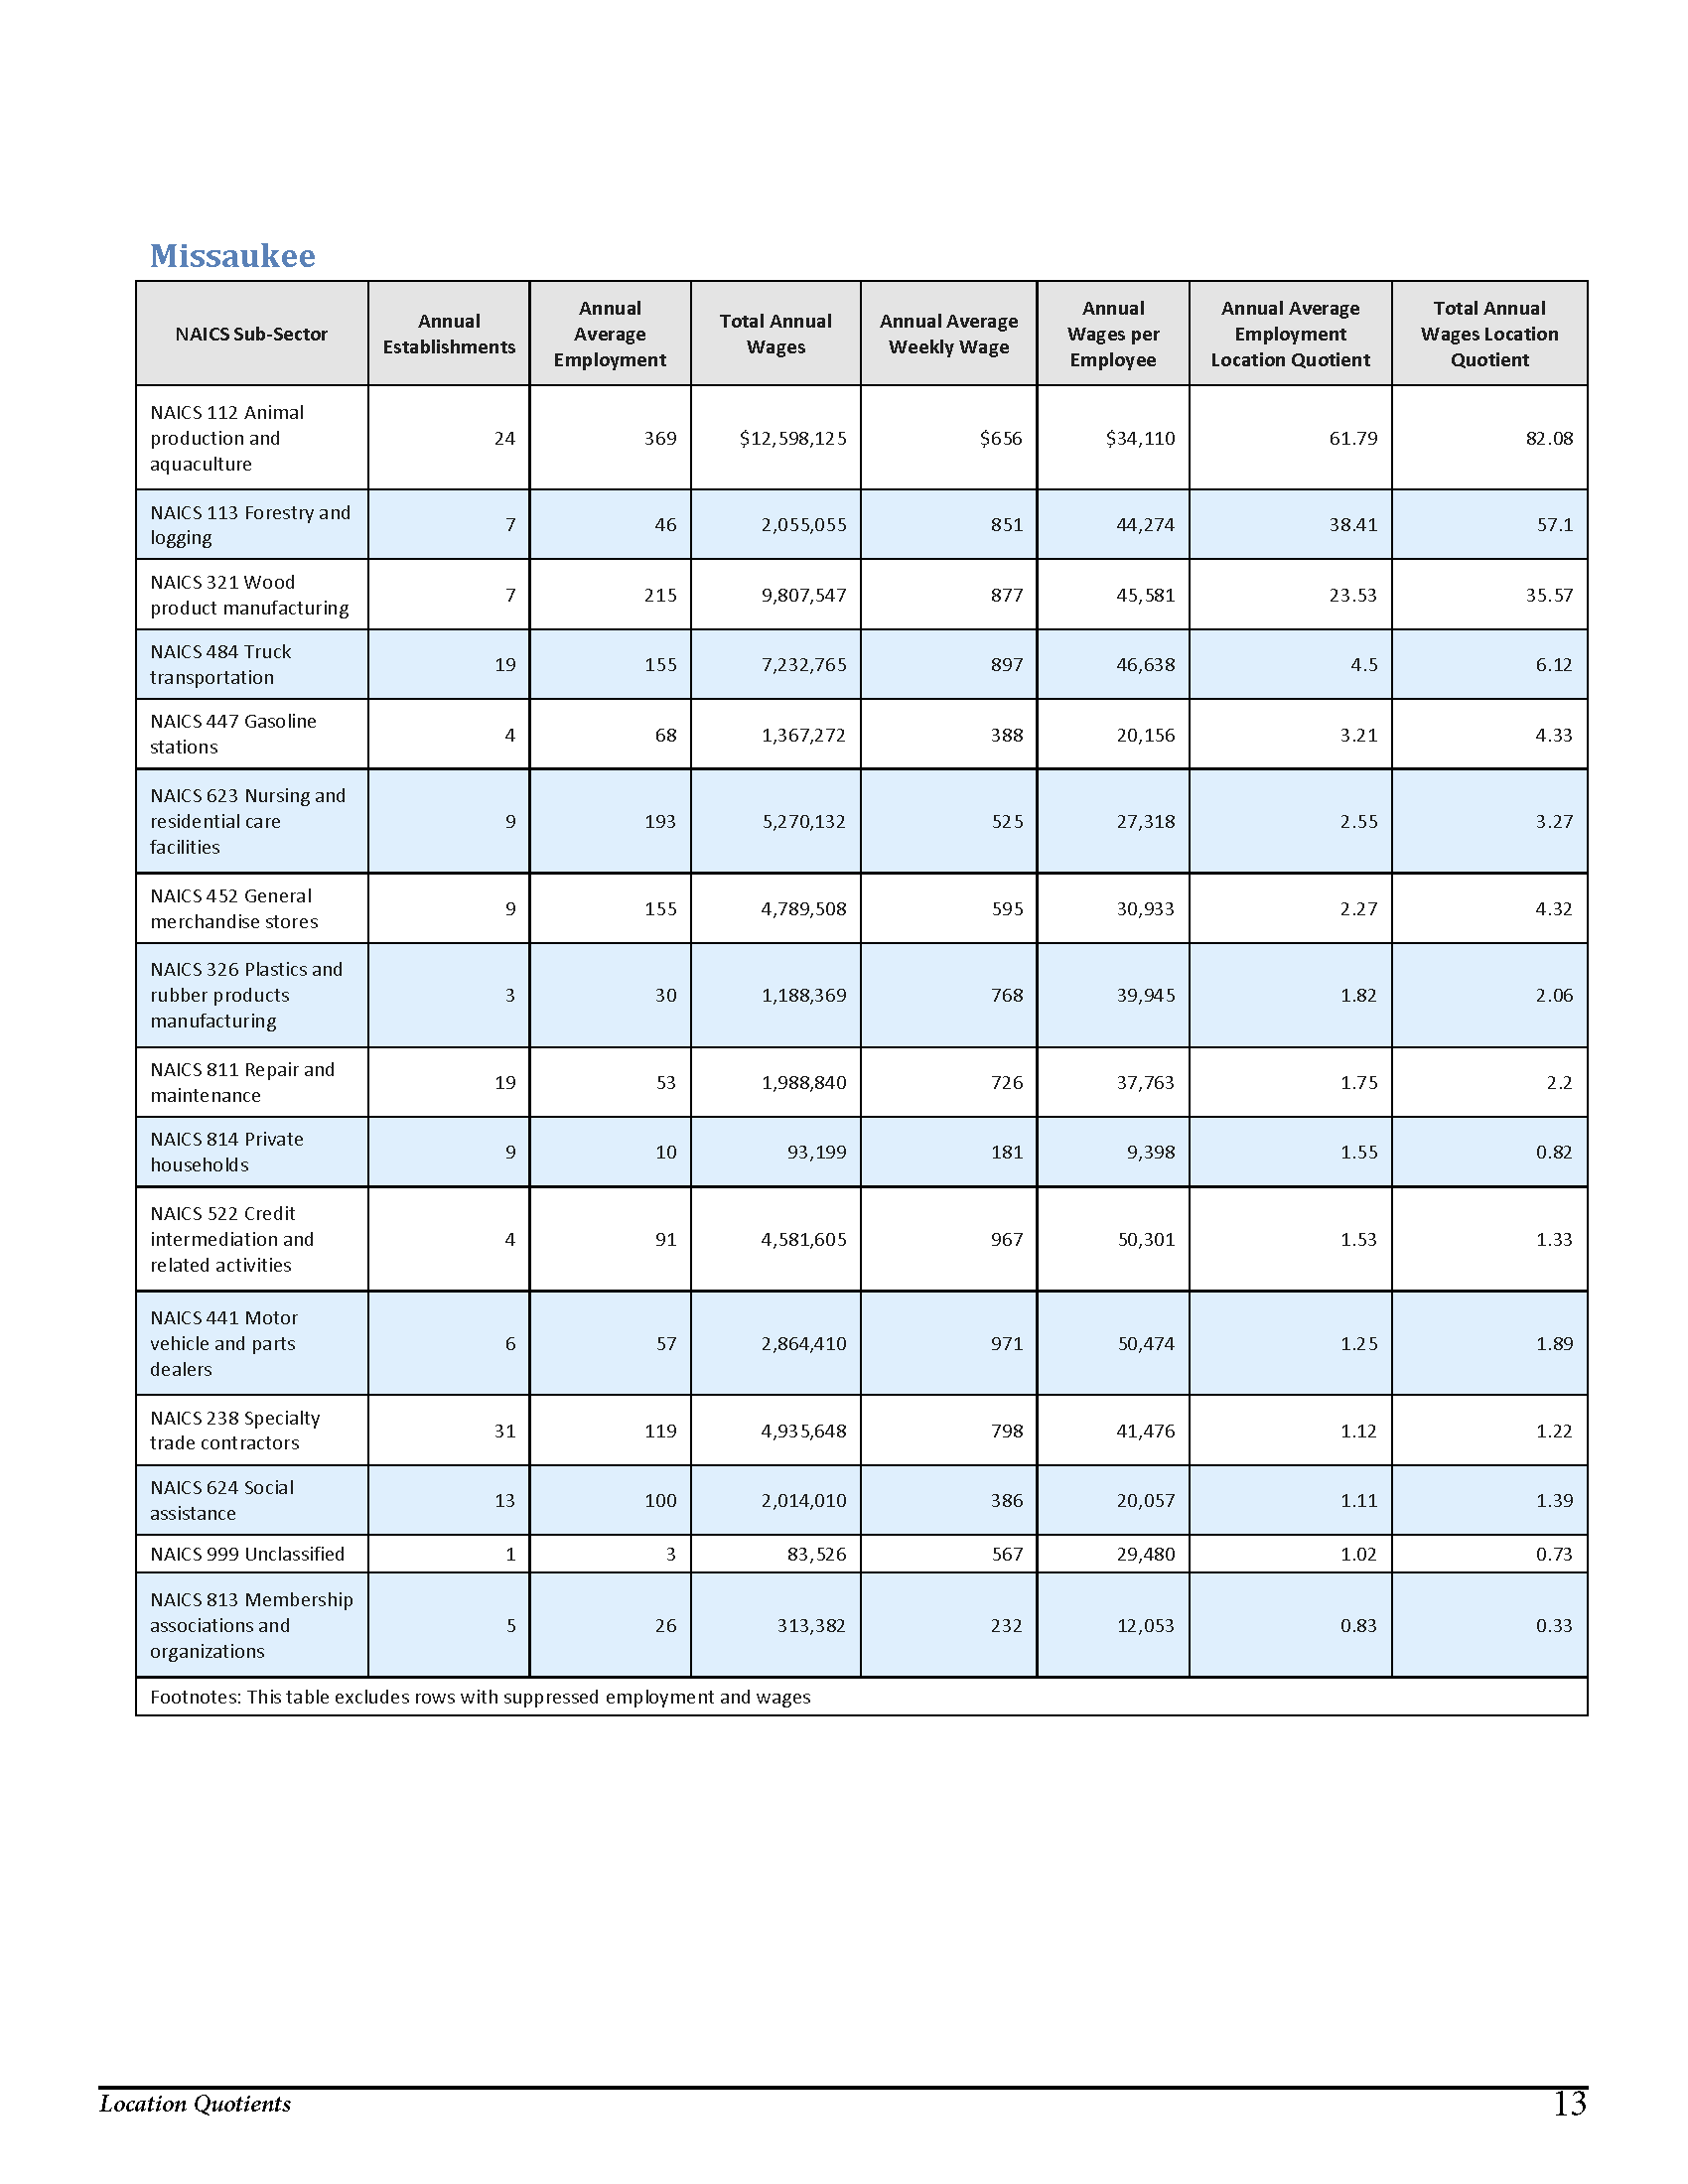
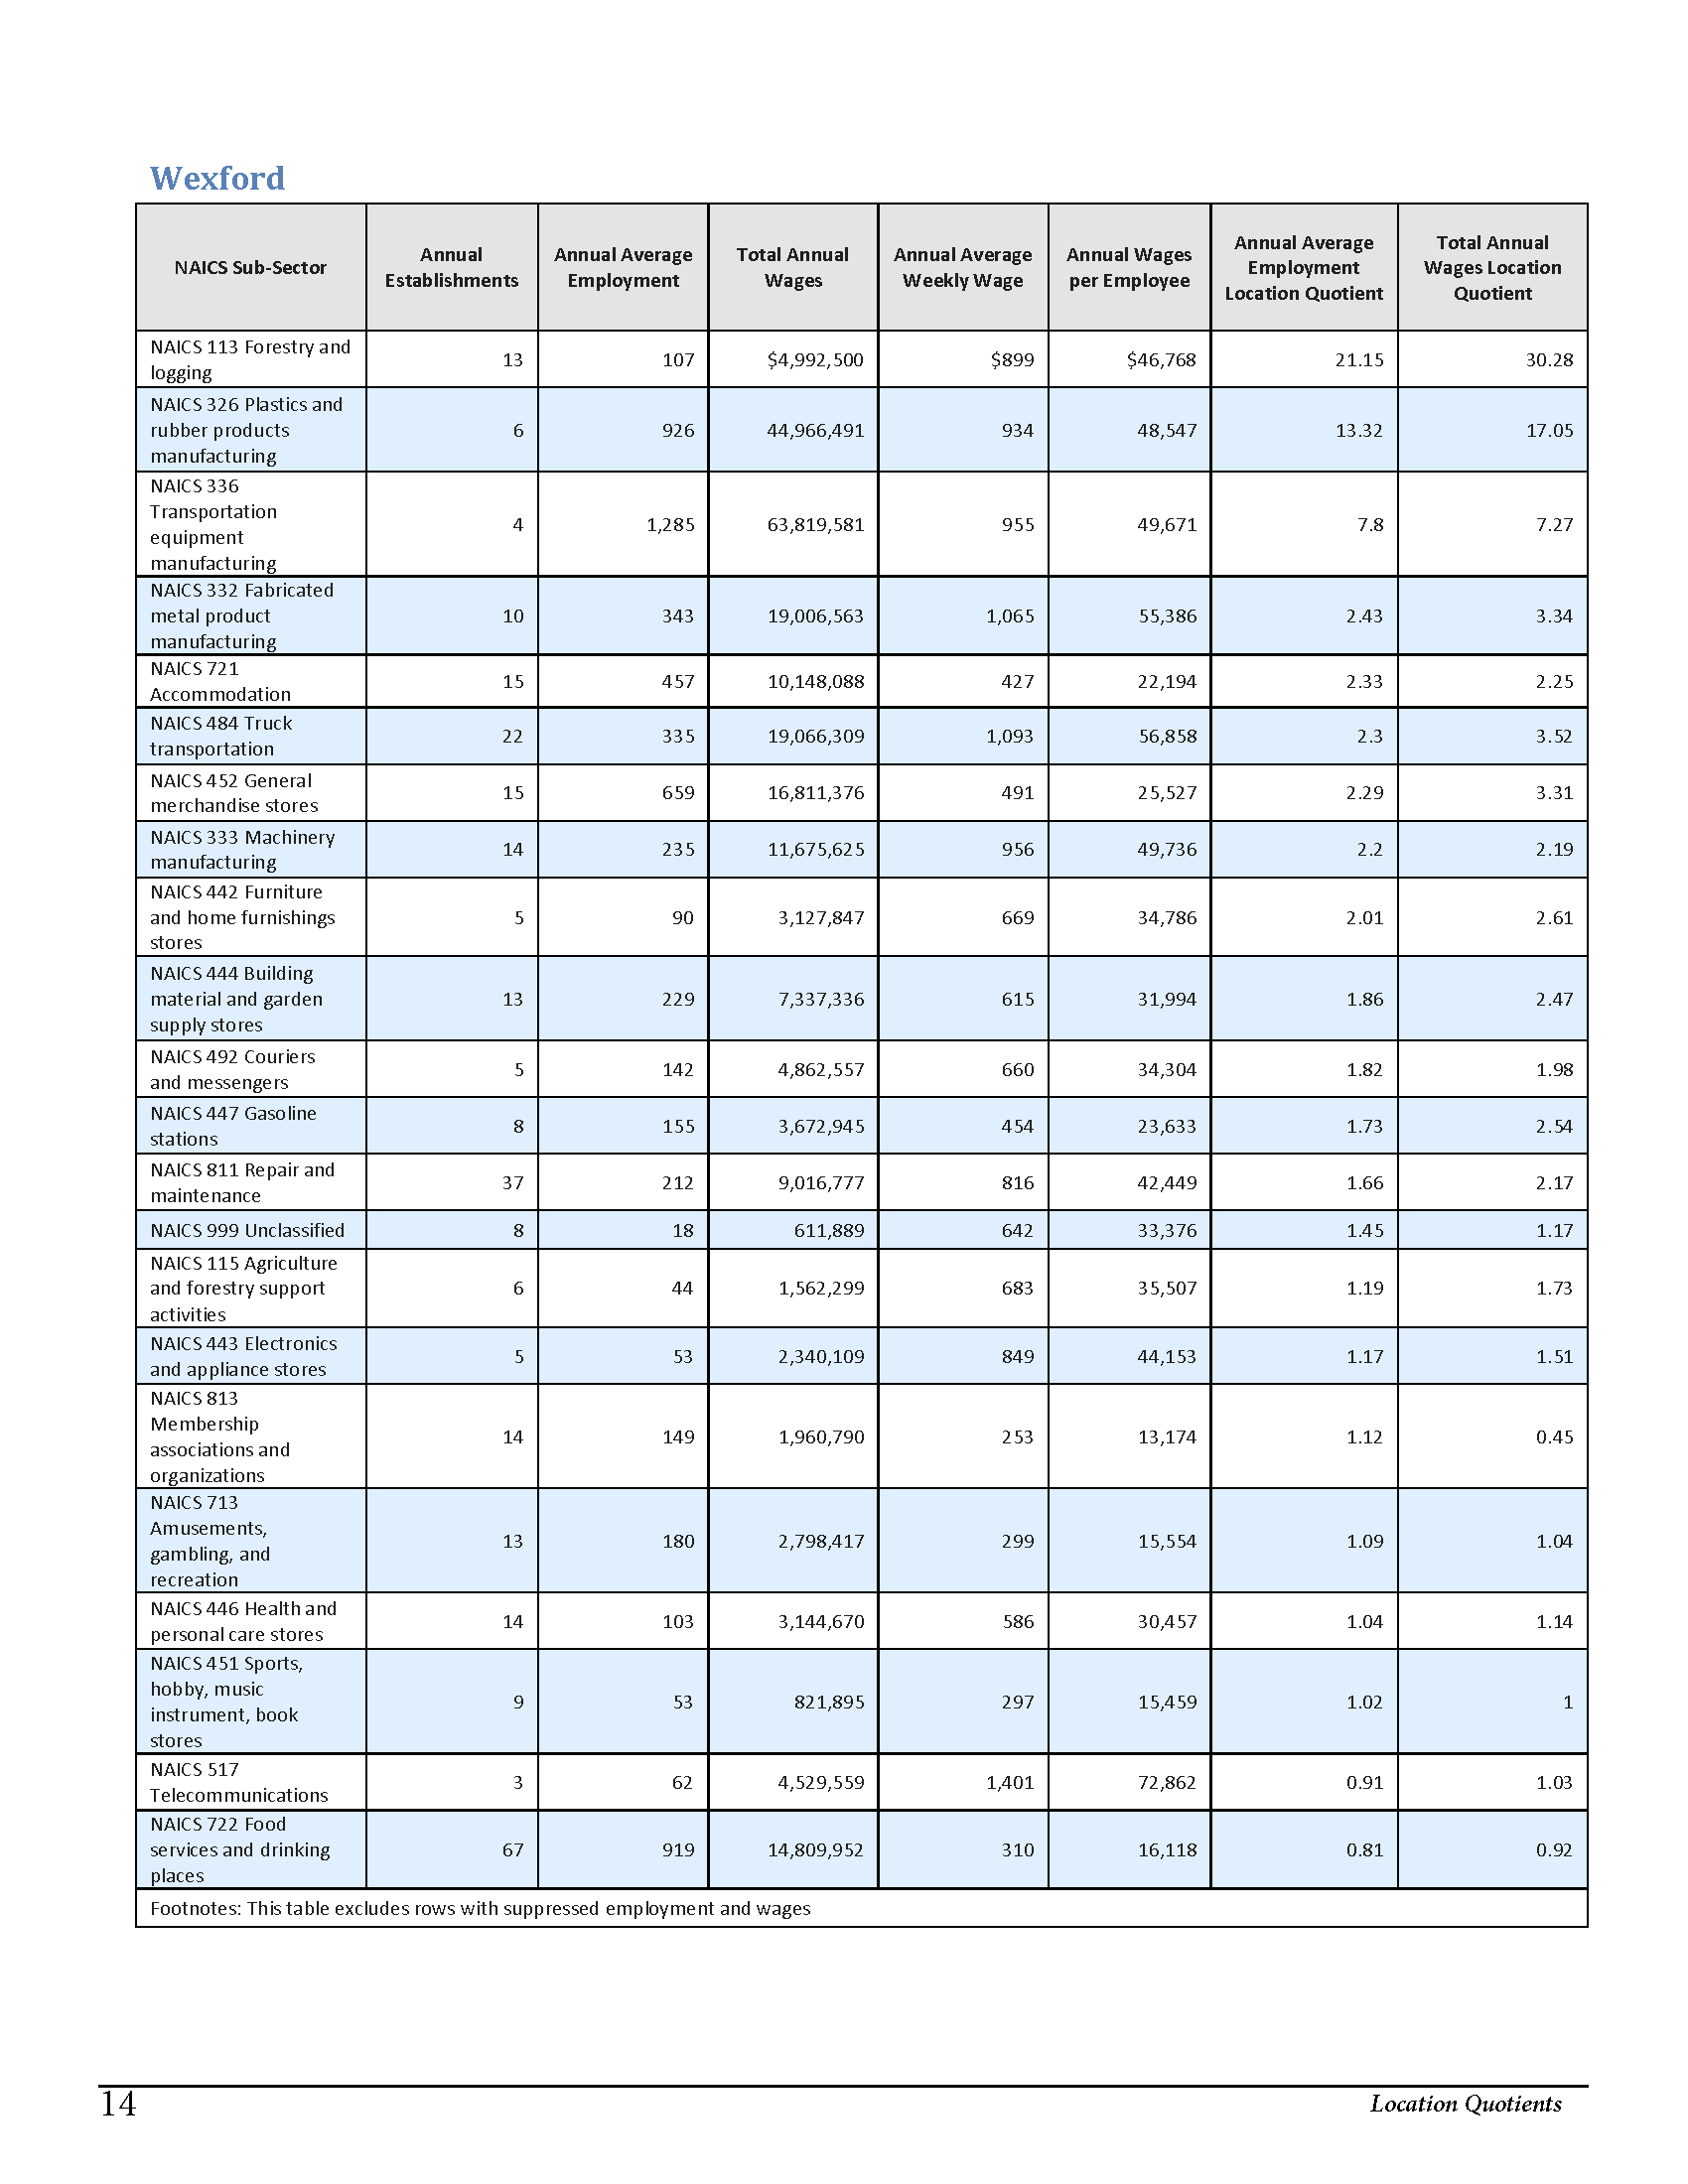
The location quotient analysis is a measure of how concentrated an industry is in the local economy. Knowing the LQ score for various industries can help the municipality: 1) to determine which industries make the local economy unique, 2) to identify which industries the locality is exporting, 3) to identify emerging export industries that are starting to bring economic activity into the local market, and 4) to identify export industries that have the potential to threaten the region’s economic base.
Location Quotient = (Local Industry Employment / Total Local Employment) / (National Industry Employment / Total National Employment)
A score of 1.0 means that the concentration of that industry in the county is equal to the concentration of that industry in the entire US. Industries with a score higher than 1.0 typically make up the local economy and can help determine what makes the local economy unique. However, it’s also important to consider the LQ score in conjunction with the number of establishments and employees and wages to truly glean how important that industry is to the local economic base. Most localities strive to have many sectors with a LQ score greater than 1. This is an indicator that the economic base is diverse and not relying heavily on one or two industries (think Detroit and automobile manufacturing). LQ scores lower than 1 can help identify sectors to target for growth. The tables in this section only show NAICS Sub-Sectors that have a LQ score of 0.8 or higher. In addition, the tables provided by the Bureau of Labor Statistics do not include rows with suppressed data. This is common for smaller study areas in order to avoid the inclusion of identifying information. Although the data used in this analysis does not list the specific industries excluded for this reason, the Shift-share analysis found in the Appendix lists the industries excluded through the Michigan REAP project’s data collection, which likely overlaps with the BLS’s data.
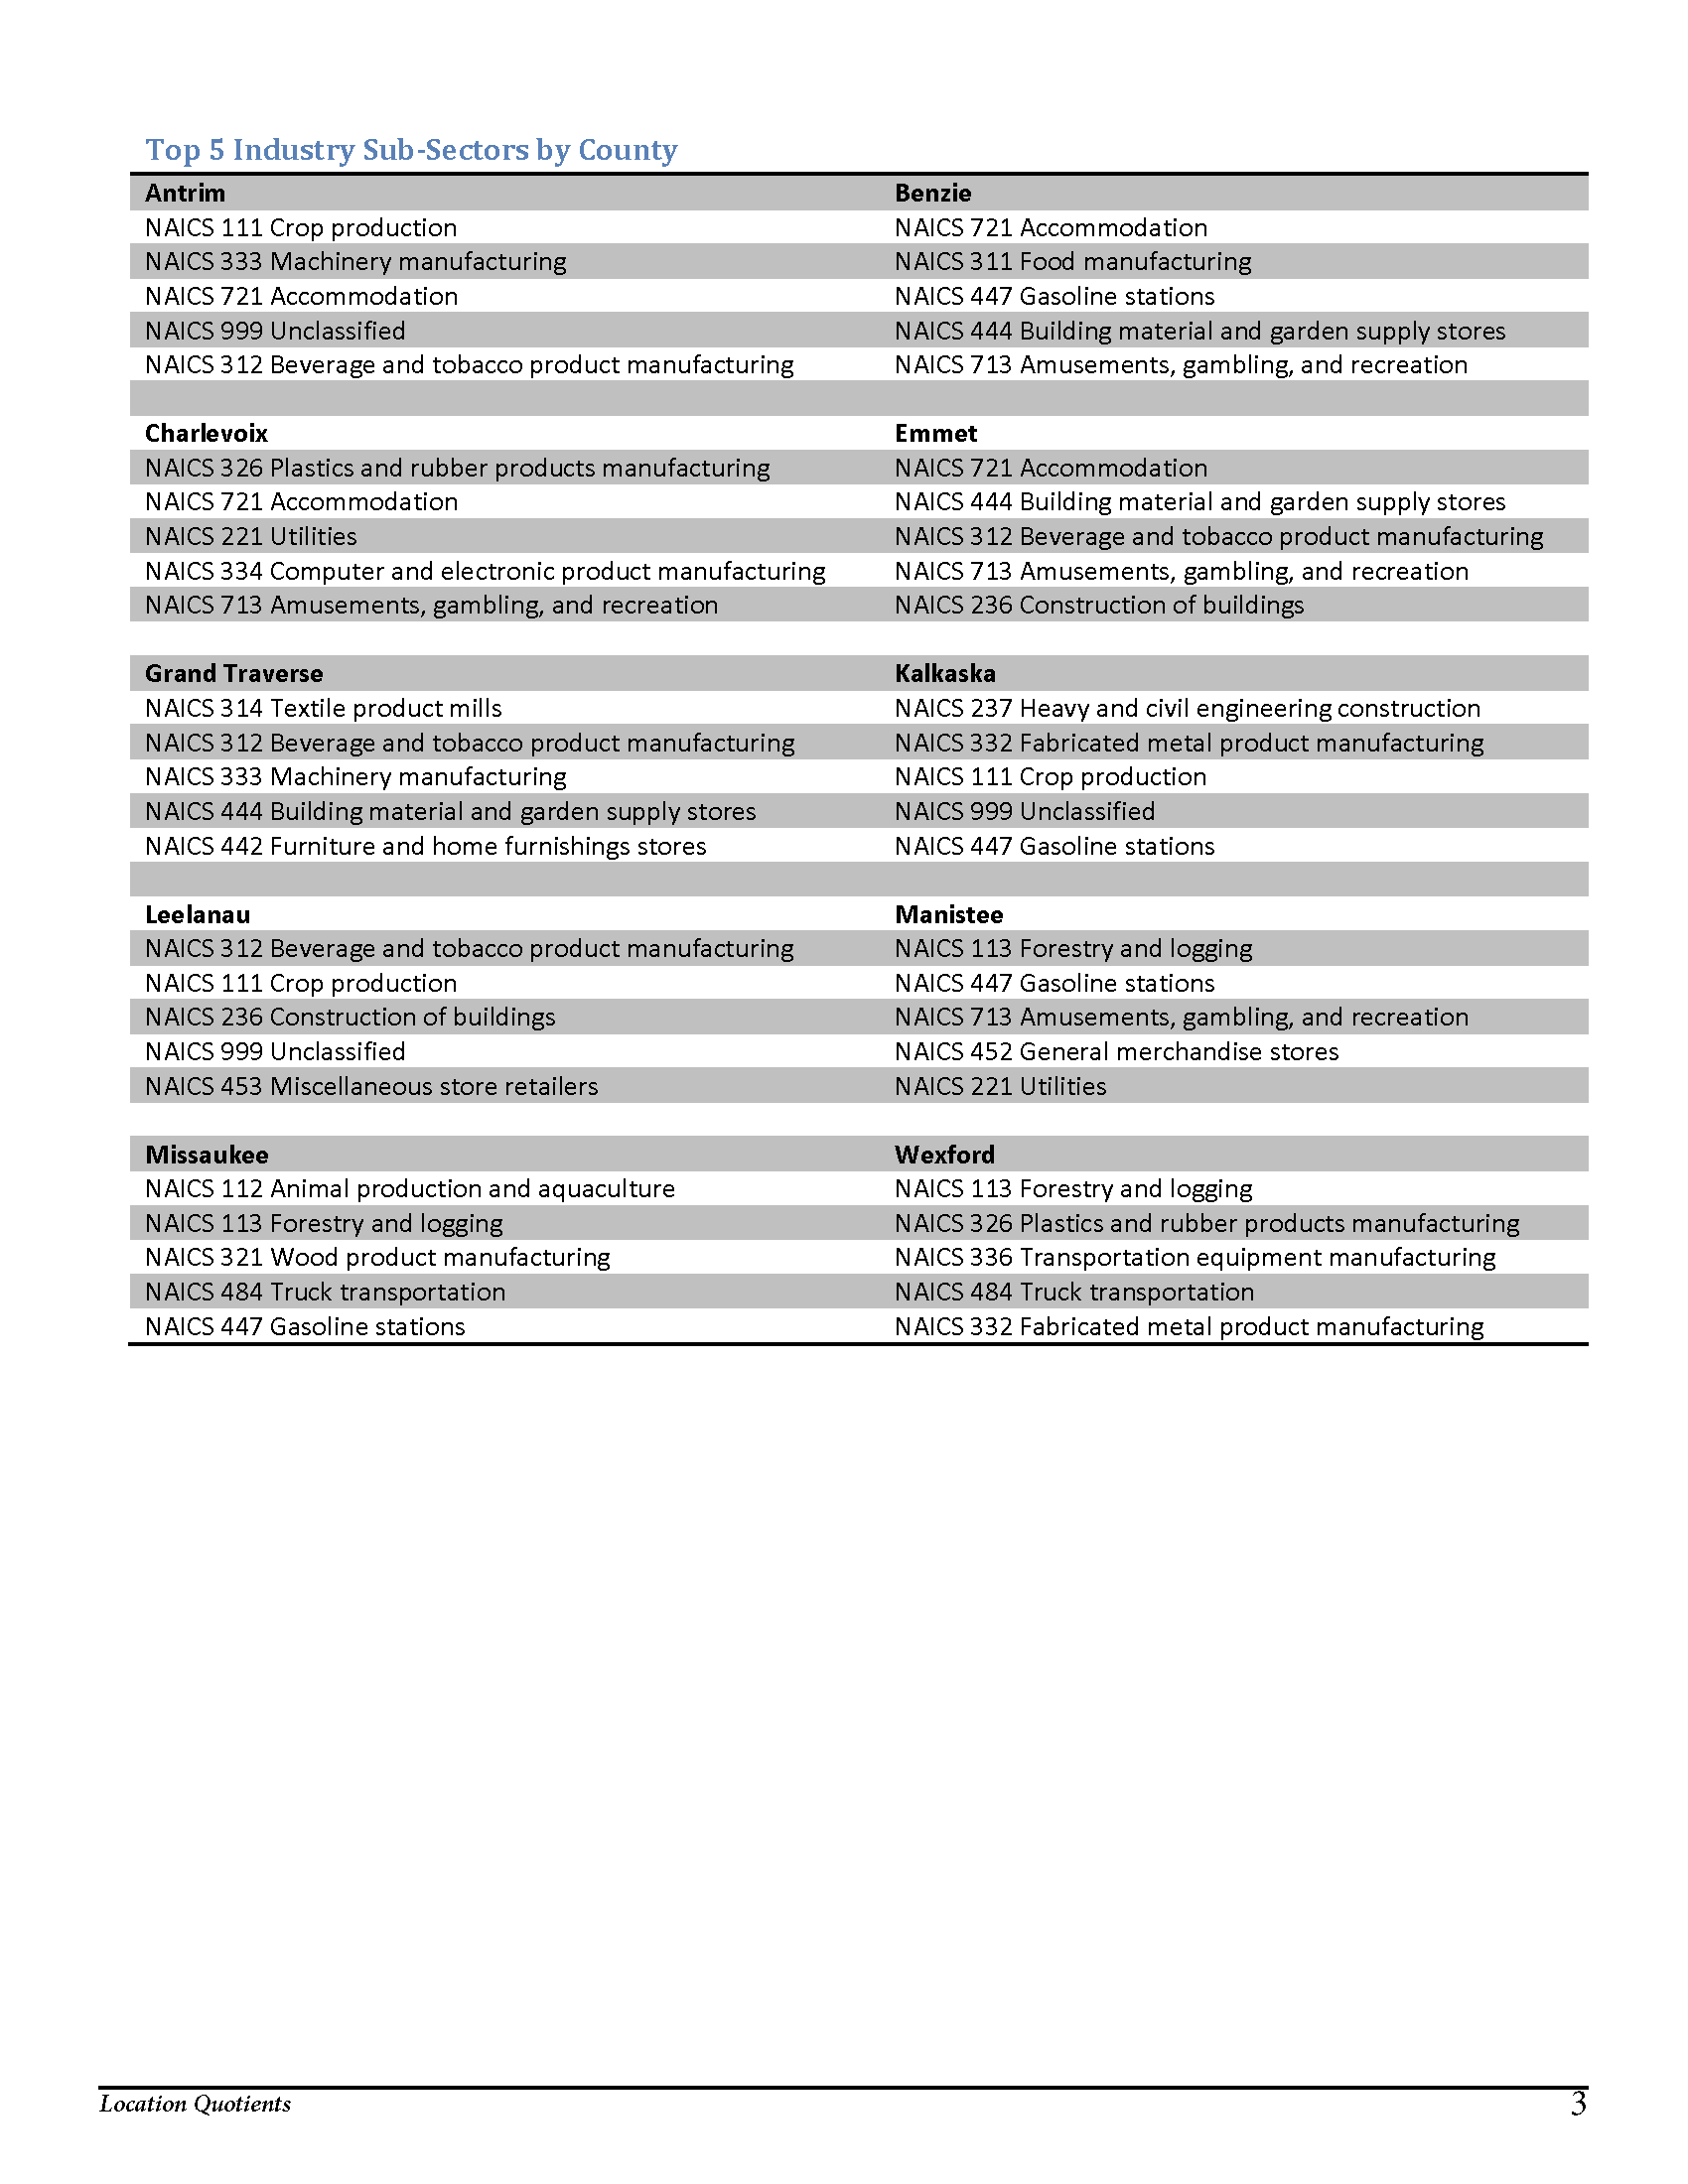
The table below shows the top five industry sub-sectors for each of the 10 counties. This anecdotal analysis was completed by adding the annual employment LQ score with the annual wages location quotient. From this one can partially determine the region’s most unique or important industry sub-sectors, or those that the region can cluster development around. This analysis also helps to discern the region’s character. For instance, industries that cater largely to tourism can be found in nearly every county, including Accommodation; Gasoline stations and Amusements, gambling, and recreation. Aside from the region’s overall character, an individual county’s character can be garnered by analyzing its economic bases. For example, Emmet County’s top industries include Accommodation; Beverage and tobacco product manufacturing and Amusements, gambling, and recreation, largely indicating that Emmet is heavily focused on tourism. In contrast, Wexford’s top industries include manufacturing NAICS subsectors and Forestry and logging.
