Overview of the Economy
REGIONAL CONTEXT
DEMOGRAPHIC TRENDS | SOCIOECONOMIC PROFILE
CEDS 2017 was written with a focus on emerging from the Great Recession and developing strategies to create broad-based prosperity. As the region was finally recovering from the recession, the Covid-19 pandemic hit, and as before the impacts of this new disruption will not be fully known until years from now. [Note: Some of the data that informs the following section does not reflect 2022 conditions, and as such will not fully capture the impact of the pandemic. Additionally, 2020 Census data have not been fully released as of the time of this report.]
This section examines factors that contribute to the overall economic health of the region and its residents and addresses the region’s competitiveness and resiliency. CEDS 2017 characterized the 1 percent growth in population between 2005 and 2015 as being unable to support or sustain economic development. Recent Census data indicate a decline in the region’s population between 2010 and 2020 of just over 2 percent. Per the U.S. Census Bureau’s 2021 American Community Survey (ACS), the population
Education
Covid-19 impacted education on many levels. The sudden shift to online learning and cancellation of graduations and celebrations of achievement affected the social and emotional well-being of students, staff and parents. Researchers at Columbia University concluded that disadvantaged students were more likely to be engaged in remote schooling during the pandemic, and fear that this less effective instruction will widen the achievement gap. Disadvantaged students also often lack computer access or a quiet study area at home and are less likely to have help from parents or tutors.
Schools may be back in session, but staffing shortages are now an issue at every level – from bus drivers, cafeteria workers and housekeepers to para-educators, teachers and substitutes. Schools are also struggling to find funding for new federal and state covid recovery mandates.
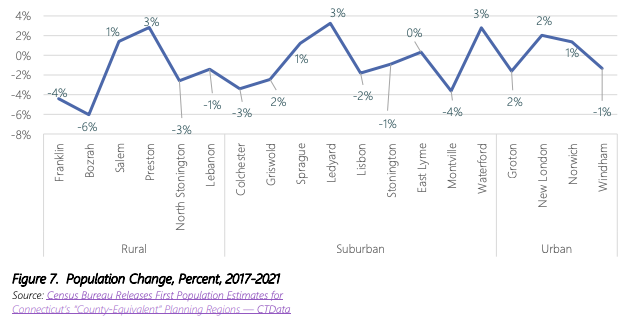
of the seCTer region is 279,918, down (-1.15 percent) from 283,174 in 2017 (Figure 7). Between 2017 and 2021, 11 municipalities in the region saw a drop in population, the greatest in Bozrah at -6 percent. Waterford, Ledyard and Preston grew by 3 percent. Though the region has lost residents, those who remain are younger when compared statewide, particularly in the 18-34 years age category (Figure 8).
A comparison of race between 2017 and 2021 shows a 2 percent increase in population with two or more races and a 3 percent decrease in those identified as one race,
suggesting that the seCTer region has become slightly more diverse (Figure 9). This is consistent with the 10-year trend of non-white population in the region. Salem, Montville and Preston are the only towns in the EDD to see their percentage of nonwhite population increase over the past 10 years (Figure 10).
Education attainment dropped slightly at the K-12 and College Undergraduate levels in the region. Windham saw a significant decline in K-12 graduation rates while EASTCONN, one of Connecticut’s six nonprofit Regional Educational Service Centers serving 33 towns and 36 school districts in northeastern Connecticut, saw a 10 percent increase. Psychology and Business Administration topped the list of most awarded 4-year degrees in 2020-2021.
EMPLOYMENT & WAGES
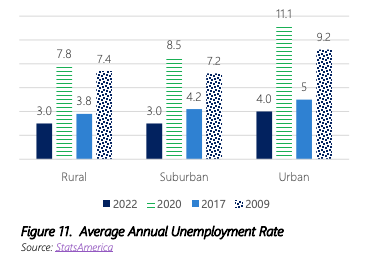
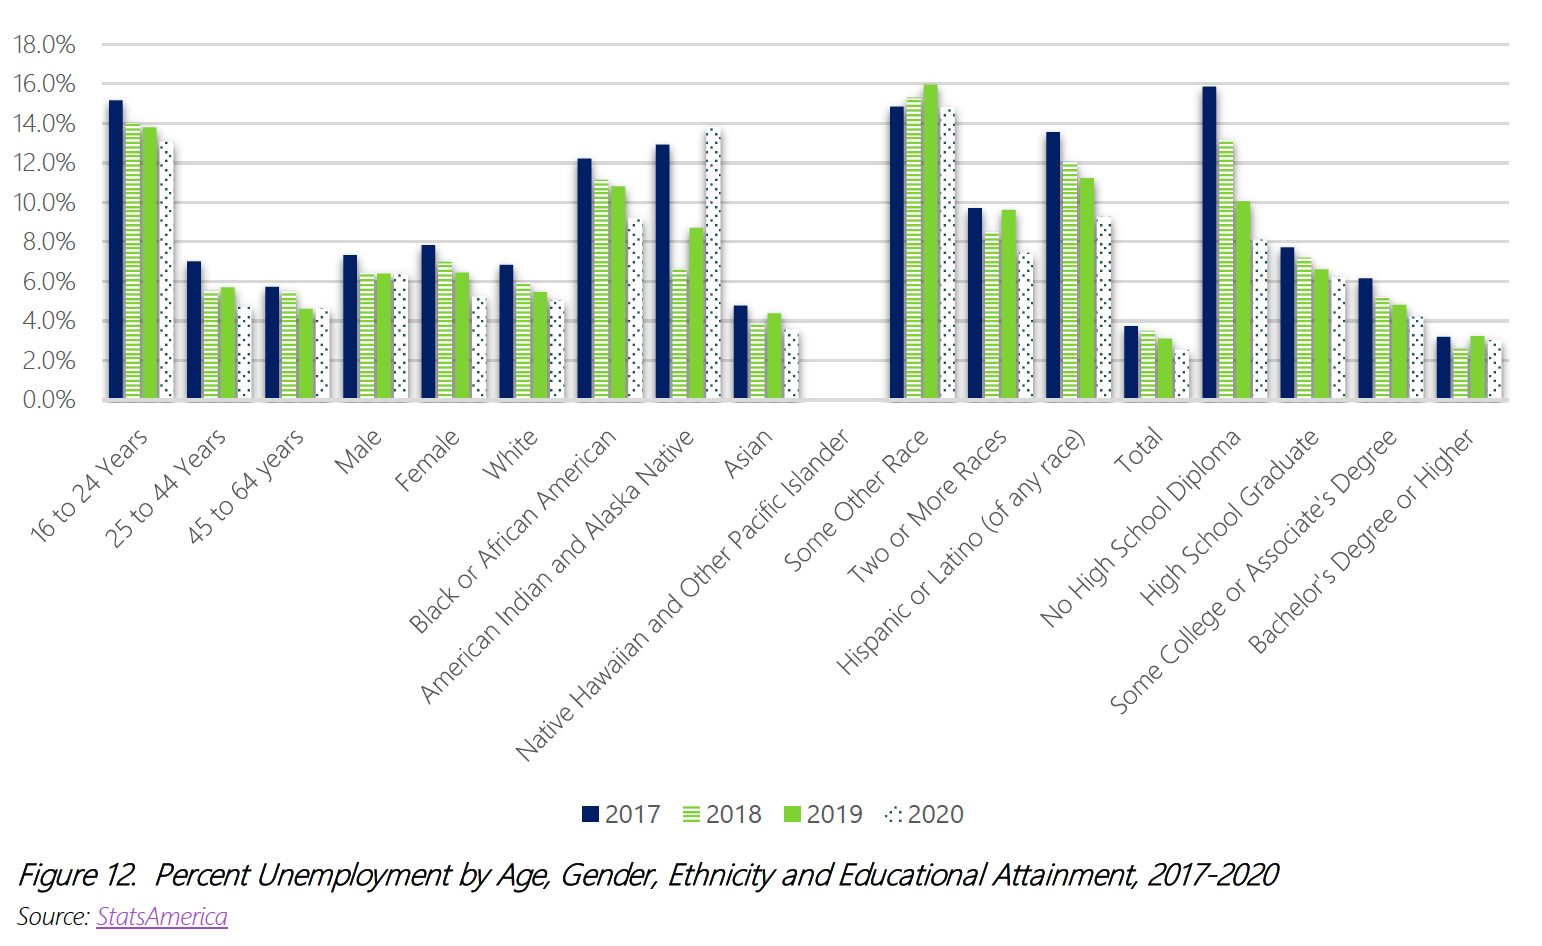
Similar to that during and after the Great Recession, unemployment rates in the region spiked in the pandemic, but unemployment rates in 2022 were lower than those reported in CEDS 2017 (Figure 11). Abundant opportunities exist for skilled workers in the EDD given General Dynamics Electric Boat’s hiring projections of 3,050 workers in 2022 and beyond. Between 2017 and 2018, American Indian and Alaskan Native residents saw a significant drop in unemployment from 12.9 to 6.6 percent, but were the only group that experienced an overall increase in unemployment in 2020 (Figure 12). Race continues to play a role in unemployment as reflected by the unemployment rate of white workers being nearly half that of most other ethnic groups or those identified as “two or more races.” Interestingly, data indicate that workers who lacked a high school diploma or college education still saw unemployment rates drop from 15.9 percent in 2017 to 8.1 percent in 2020, reflecting a tightening of the regional job market, but 2020 rates remain much higher than those with a college education.
Over the next year, employment in the SECT EDD is projected to contract by 1,089 jobs (-0.8 percent). The fastest growing sector in the region is expected to be Accommodation and Food Services with a +0.9 percent year-over-year rate of growth. The strongest forecast of employment growth over this period is expected for Accommodation and Food Services (+180 jobs), Mining, Quarrying, and Oil and Gas Extraction (-1), and Arts, Entertainment, and Recreation (-7) (JobsEQ® as of 2022Q3).
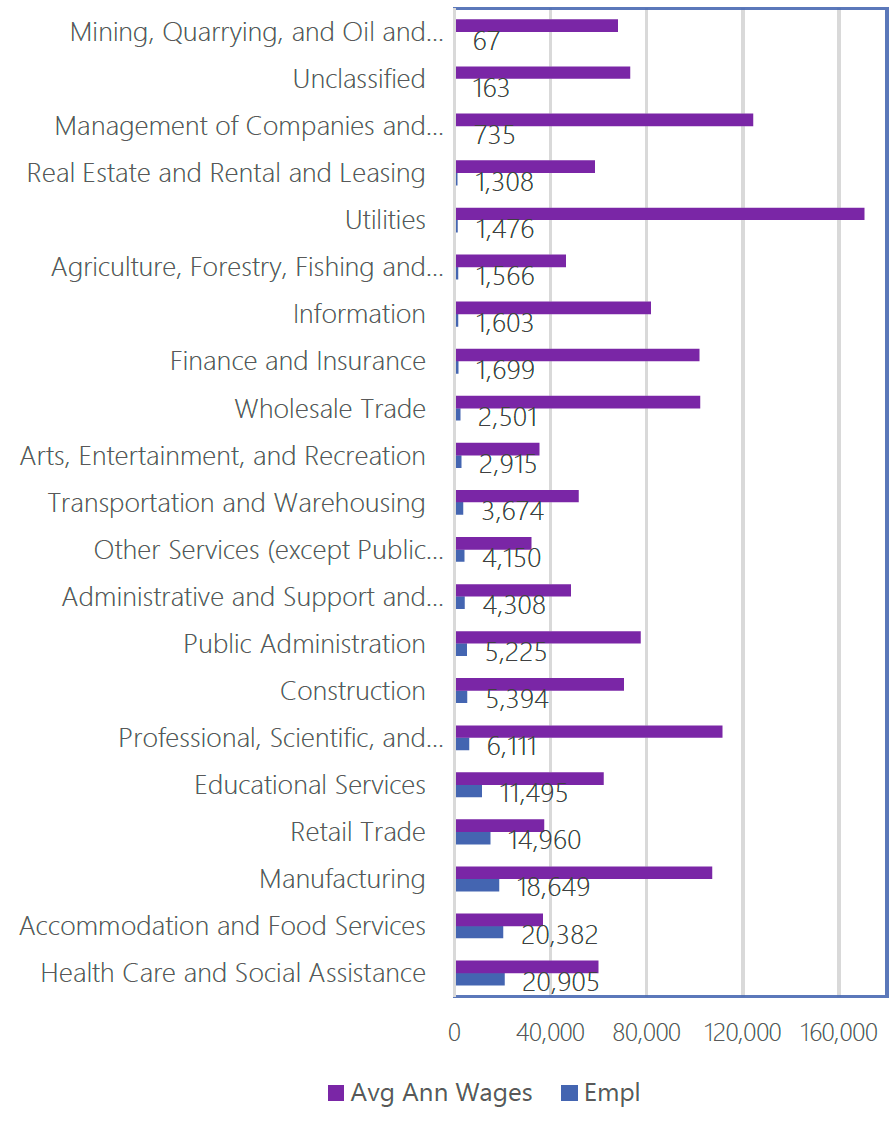
The largest industry sector in the SECT EDD is Health Care and Social Assistance, employing 20,905 workers, followed by Accommodation and Food Services (20,382 workers) and Manufacturing (18,649) (Figure 13). In terms of private industry, Health Care and Social Assistance is the largest employer with average wages of $59,936. Manufacturing remains a key contributor to the region’s employment base with 18,649 workers with an average wage of $107,000. Government-related employment, which includes the Tribal Gaming Authority, is also a significant source of jobs in the region, employing almost 25,900 people with payrolls exceeding $407 million.
High location quotients (LQs) indicate sectors in which a region has high concentrations of employment compared to the national average. The sectors with the largest LQs in the region are Utilities (2.26), Accommodation and Food Services (1.86) and Manufacturing (1.78) (JobsEQ® as of 2022Q3).
Sectors in the SECT EDD with the highest average wages are Utilities ($170,614), Management of Companies and Enterprises ($124,289), and Professional, Scientific, and Technical Services ($111,493) (Figure 13). Regional sectors with the best job growth (or most moderate job losses) over the last five years are Accommodation and Food Services (+6,566 jobs), Manufacturing (+1,176), and Administrative and Support and Waste Management and Remediation Services (+580) (JobsEQ® as of 2022Q3).
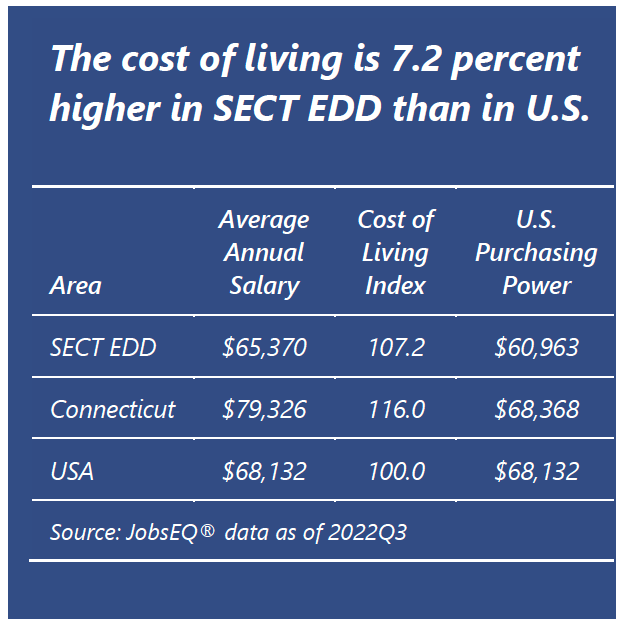
The average worker in the SECT EDD earned annual wages of $65,370 as of 2022Q3. Average annual wages per worker increased 4.3 percent in the
region over the preceding four quarters and are roughly $12,000 more than they were in 2017. For comparison purposes, annual average wages were $68,132 in the U.S. (JobsEQ® as of 2022Q3).
WAGE INEQUALITY
When comparing salaries for full-time, year-round male and female employees, the wage disparity ranges from $14,000 (Service Industry) to $43,000 (Healthcare Practitioners and Technical) in favor of men, with the only exception being the Computer, Engineering and Science Industry, where the salaries for women were just over $3,000 higher than those for men in 2021. Regional inflationadjusted data suggest earnings for women increased by 1.2 percent of male earnings between 2017 and 2021.¹
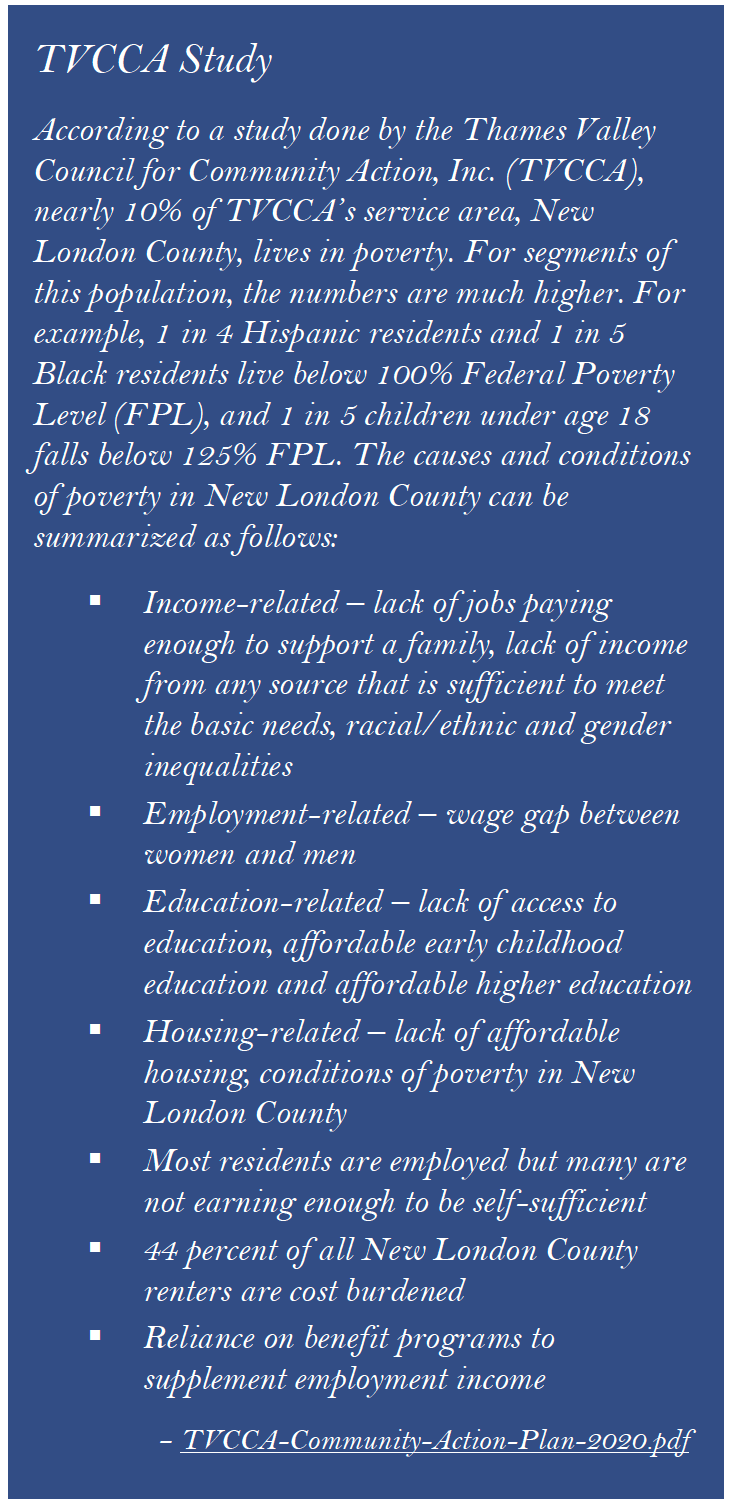
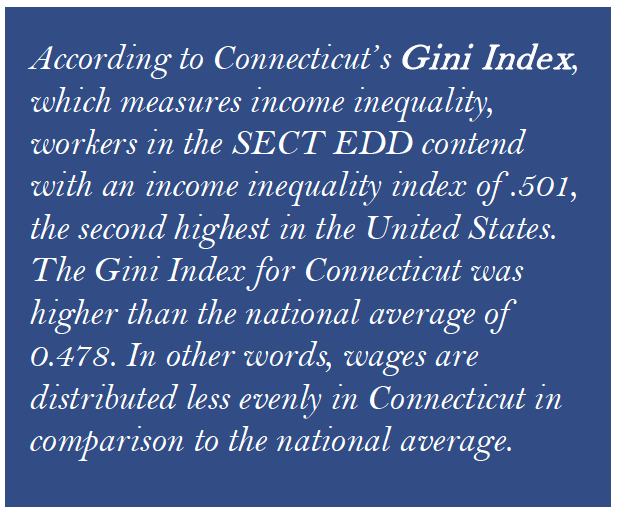
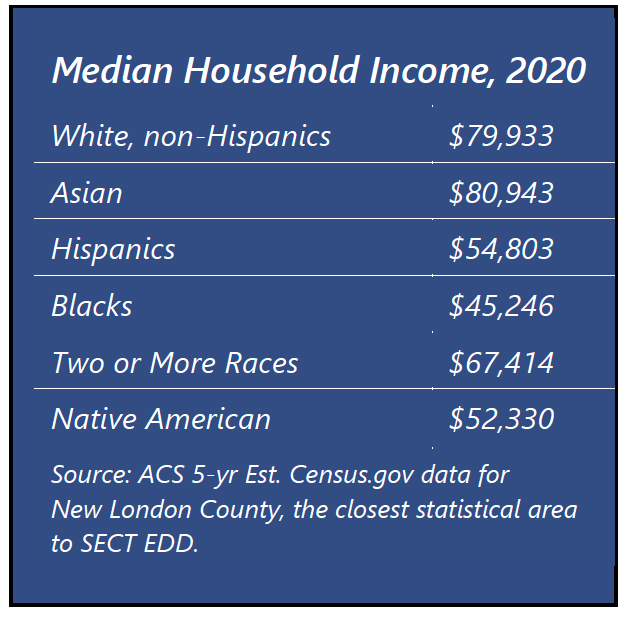
Wage inequality is most pronounced when comparing household income and race. White, Non-Hispanic household income is approximately 43 percent higher than the household income for Blacks (ACS 5-year estimate. Census.gov data for New London County, the closest statistical area to SECT EDD).
While inequality persists in Connecticut, it did narrow slightly over the last two years due to mandated increases in the minimum wage and higher demand for workers. In May 2019 the CT Legislature passed and CT Governor Ned Lamont signed a law increasing the state’s minimum hourly wage from $10.10 to $11.00 on October 1, 2019, and then by another $1.00 every 11 months thereafter until it reaches $15.00 on June 1, 2023. Beginning January 1, 2024, the law indexes future annual minimum wage changes to the federal employment cost index (Public Act No. 19-4, An Act Increasing the Minimum Fair Wage, Public Act No. 19-4 for House Bill No. 5004).
The pandemic put additional pressure on towns to rein in non-education expenses and personnel, meaning the workforce in many local police, fire, public works and land use offices were made even leaner than they were already before the pandemic. Similar to the recovery from the Great Recession, the loss of public sector jobs slowed Connecticut’s recovery from the Covid-19 pandemic. Government at all levels can most directly address this problem by funding public sector jobs, which will boost wages for low- and middle-wage workers and subsequently increase their purchasing power. The high cost-of-living index (107.2) for the region, reduces the purchasing power of the average annual wage in the EDD to only $60,963 (JobsEQ® data as of 2022Q3). The high cost of living has likely contributed to some leaving the region, but overall New London County showed slightly more immigrants than out-migrants between 2017 and 2021, with a net gain of 539 migrants (U.S. Census Bureau, American Community Survey). The existing wage gap, high number of cost-burdened households, income inequality, lack of supporting services that allow full participation in the workforce, and decreased population resulting in part from the pandemic, all signal an opportunity for the region to develop strategies to “retool” its available workforce, provide services to enable participation by all in the workforce, and address inequalities in wages. seCTer’s ongoing CEDS work, including the development of CEDS 2023, comes at a time when stakeholders in the region are looking for a clear, cohesive plan to follow to build capacity and resiliency and address inequalities that directly impact the region’s economic wellbeing. Developing CEDS 2023 is one thing; implementing it and allowing to evolve and adapt is another, requiring the cooperation and collaboration of key stakeholders throughout the region. The CEDS 2023 5-year implementation process is detailed in Section 5 Implementation and Evaluation Framework.
